
What Is Drawing Fresh Attention To Fox (FOXA)?
Fox rebound puts digital and political ads in focus
Fox (FOXA) is back in the spotlight as investors react to a rebound linked to stronger political advertising and expanding digital activity through Tubi and other streaming services.
Recent trading tells a mixed story for Fox, with the share price down 7.6% over the past month and 13.3% year to date, even as a 30.9% 90 day share price return and a multi year total shareholder return of 114.1% suggest that longer term momentum has been strong.
Scan beyond Fox and identify other media and advertising players showing sharp momentum in our hand picked list of 30 high quality undervalued stocks.
Fox’s sharp 90 day rebound contrasts with a weaker year to date record and a modest 1 year total return. Is this latest burst tracking real business strength or just sentiment catching up, and how does current pricing reflect that?
Most Popular Narrative: 16% Undervalued
On the most followed view of Fox, a fair value of $76.42 versus the recent $63.96 close points to a discount, with that gap hinging on how well digital and connected TV initiatives convert into earnings power.
The planned Roku acquisition, with guided run rate cost synergies of about US$400 million, anticipated free cash flow per share accretion within two years of closing and continued US$1 billion to US$1.5 billion in annual buybacks, offers a path to higher earnings power and cash flow through both cost efficiencies and capital returns.
See why 6 investors see Fox as 16% undervalued.
Result: Fair Value of $76.42 (UNDERVALUED)
Still, the Fox narrative can crack if regulators push back harder on the planned Roku deal, or if pay TV declines outpace growth at Tubi and FOX One.
Find out about the key risks to this Fox narrative.
Another View: Fox Through A Cash Flow Lens
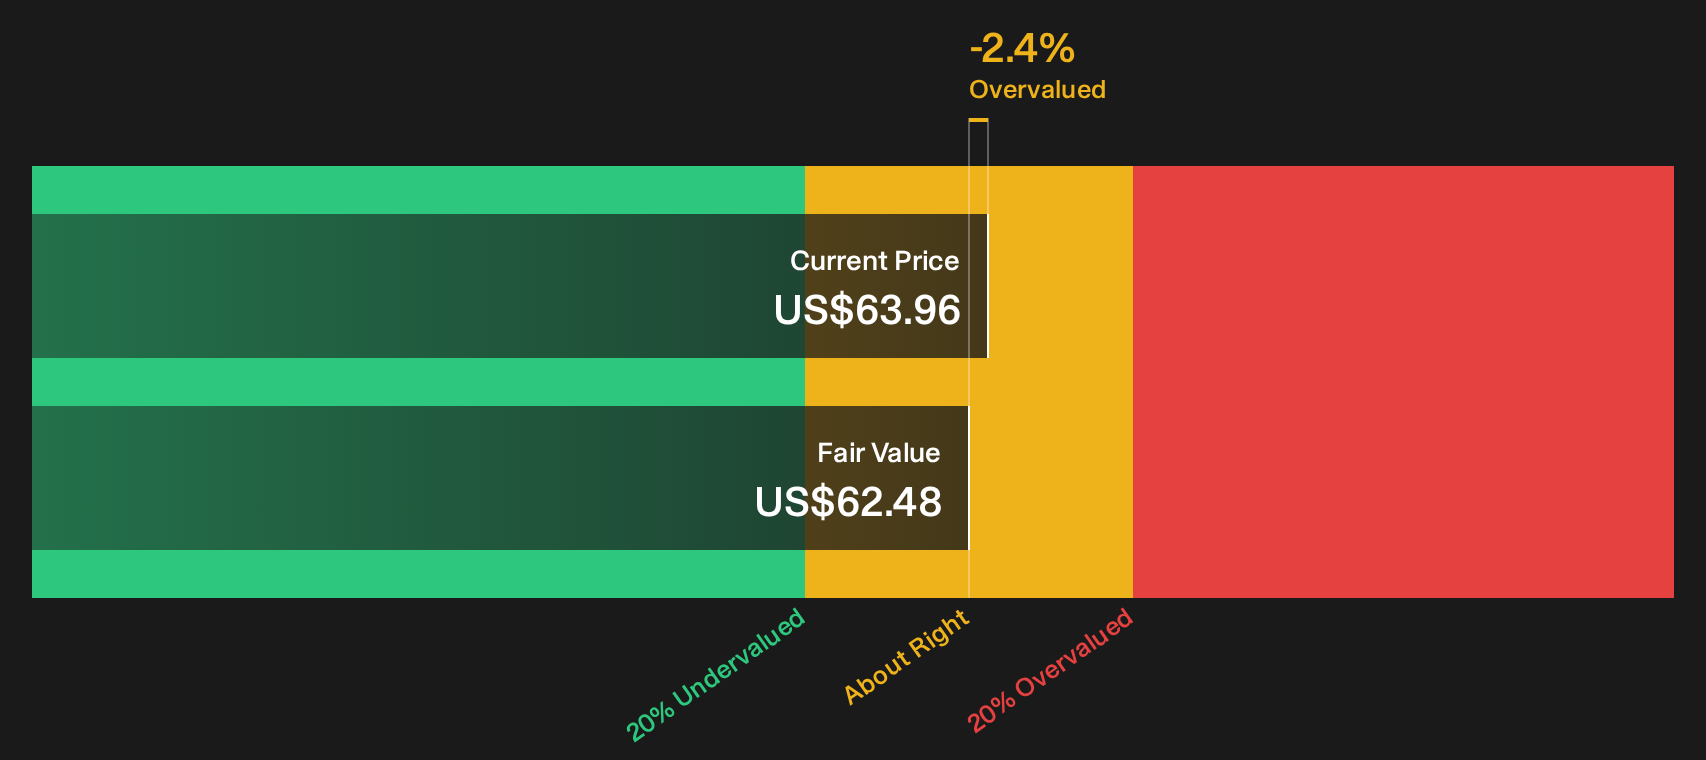
There is a catch. While the popular Fox story leans on a $76.42 fair value tied to future earnings power, the SWS DCF model points to a fair value of $62.48. With the stock around $63.96, that cash flow view suggests little cushion and raises the question of which set of assumptions you trust more.
Our DCF model is only as strong as the inputs you compare it against, so it can be worth seeing how those cash flows are built up and stress testing them against your own expectations. Look into how the SWS DCF model arrives at its fair value.
For a visual sense of how those projected cash flows stack up against the current share price, see the valuation snapshot below.
Simply Wall St performs a discounted cash flow (DCF) on every stock in the world every day (check out Fox for example). We show the entire calculation in full. You can track the result in your watchlist or portfolio and be alerted when this changes, or use our stock screener to discover 30 high quality undervalued stocks. If you save a screener we even alert you when new companies match - so you never miss a potential opportunity.
Next Steps
Mixed signals around Fox can feel confusing, so move quickly from headline noise to hard numbers and decide where you land on the balance of risks and upside. To help frame that view, start with the 3 key rewards and 2 important warning signs.
Looking for more Fox investment ideas?
If you only stop at Fox, you risk missing other opportunities that fit your style, your risk comfort and your return expectations just as well.
- Target higher income potential by scanning dividend payers that combine yield with resilience through the 7 dividend fortresses.
- Spot underappreciated quality by running a focused search for companies trading below what their fundamentals suggest using the 30 high quality undervalued stocks.
- Protect your downside by concentrating on businesses with stronger balance sheets and healthier fundamentals in the list of solid balance sheet and fundamentals (23 results).
This article by Simply Wall St is general in nature. We provide commentary based on historical data and analyst forecasts only using an unbiased methodology and our articles are not intended to be financial advice. It does not constitute a recommendation to buy or sell any stock, and does not take account of your objectives, or your financial situation. We aim to bring you long-term focused analysis driven by fundamental data. Note that our analysis may not factor in the latest price-sensitive company announcements or qualitative material. Simply Wall St has no position in any stocks mentioned.
Have feedback on this article? Concerned about the content? Get in touch with us directly. Alternatively, email editorial-team@simplywallst.com