
Xylem (XYL) Raises Fresh Debt On A Valuation Story That Still Looks Undervalued
Xylem (XYL) has just raised fresh debt through several fixed rate note offerings, giving investors a new reference point on the company’s funding costs and balance sheet flexibility relative to the stock.
At a share price of $108.64, Xylem has seen short term momentum soften, with a 30 day share price return down 4.85% and year to date share price return down 20.76%. However, the 3 year total shareholder return of 24.86% points to a stronger longer term record than the recent 1 year total shareholder return, which is down 22.12%, and frames this new debt issuance as another data point for how the market is reassessing both its growth potential and risk profile.
Compare Xylem’s latest funding move with other capital intensive businesses by scanning our hand picked list of solid balance sheet and fundamentals (23 results) that may be better positioned for the next rate cycle reset.
The bond deals give Xylem fresh firepower and also establish a clear cost of capital. At this share price and against those coupons, does the risk reward still lean toward buyers or away from them as valuation comes into focus next?
Most Popular Narrative: 29.9% Undervalued
On the latest numbers, Xylem’s share price of $108.64 sits well below a narrative fair value of $155, so the new bonds land against a backdrop of equity that some investors view as priced for caution rather than optimism.
What must happen: Xylem is a high-quality water-infrastructure company benefiting from essential municipal, industrial, commercial and residential water spending. Long-term demand is supported by ageing water infrastructure, water scarcity, water-treatment requirements, digital monitoring and rising data-centre water demand. The thesis depends on converting these structural trends into steady growth, margin improvement, strong free cash flow and disciplined acquisitions.
See why 1 investors see Xylem as 30% undervalued.
According to Womble, the narrative behind that $155 figure leans on several moving parts that link directly back to today’s capital structure. It assumes revenue growth of roughly 4% to 6% a year, earnings expansion of around 10% to 13%, stable or improving margins, solid free cash flow and effective integration of the $1.5b Cornell Pump and Roper Pump purchase.
The fresh notes sit alongside a business that generated $9.1b of revenue and $1.0b of net income, with an 11.2% net margin that exceeds last year’s 10.7%. That profitability supports the case that Xylem can service higher cost borrowing, although the firm does rely entirely on external funding sources rather than customer deposits, which places more weight on consistent cash generation.
One tension in the story is that forecast revenue growth of 4.6% a year and expected profit growth of 12.8% are not high relative to broader US market expectations. Earnings are projected to expand more slowly than the wider market, and return on equity is described as low at 9.5% today with forecasts of 13.2% in three years, which may cap how far investors are willing to stretch valuation multiples even if the DCF output suggests upside.
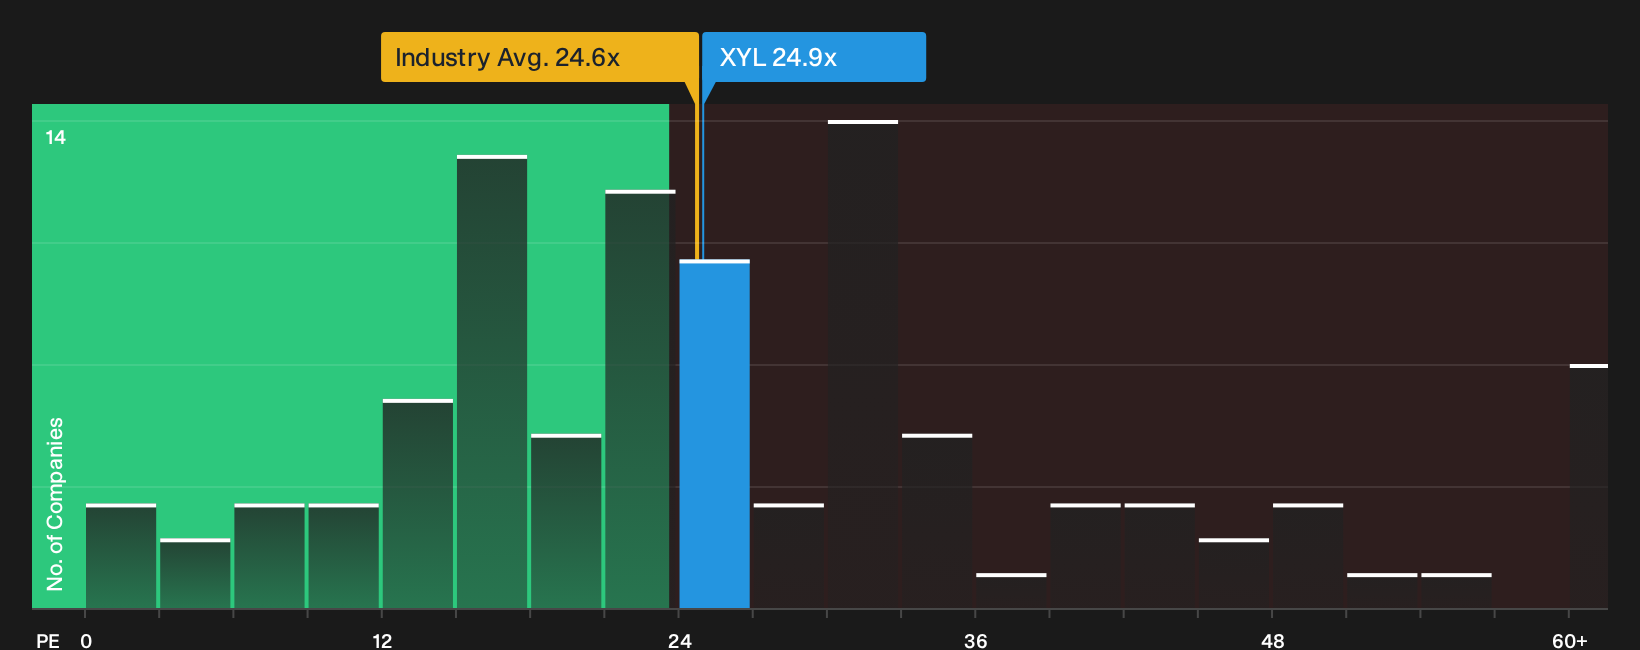
At the same time, Xylem is framed as good value compared with an internal fair P/E of 25.2x and the peer average P/E of 28.9x, even though its own multiple of 24.9x is roughly in line with the US Machinery sector. That mix paints a picture of a business where the equity market is already assigning a quality premium, yet the most widely followed valuation narrative still sees a gap between price and estimated worth.
Put together, the bond raise, the forecast mid single digit revenue expansion and the assumptions around margin stability make this a capital structure story as much as a growth one. The key test for shareholders is whether Xylem can keep converting earnings into cash while managing acquisition risk so that the estimated fair value of $155 remains credible against the current share price.
Result: Fair Value of $155 (UNDERVALUED)
Still, the Xylem story can flip quickly if revenue drops below the 3% area for an extended period or if the Cornell and Roper deals encounter integration problems.
Find out about the key risks to this Xylem narrative.
Another View: What Xylem’s P/E Is Telling You
A second lens on Xylem comes from its P/E ratio. At 24.9x, the stock trades slightly above the US Machinery group at 24.6x, but below a peer average of 28.9x and close to a fair ratio of 25.2x. This suggests limited room for multiple expansion if sentiment cools.
Investors now have a simple question to answer: Is a near fair ratio, only modestly cheaper than peers, enough of a cushion if earnings or cash flow miss expectations?
See what the numbers say about this price — find out in our valuation breakdown.
Next Steps
Confident in the bullish tone of this Xylem story, or still on the fence given how much hinges on execution and cash conversion over time? Move quickly and test the narrative against the underlying data. To see what optimism is built on and which positives analysts are watching, review the 5 key rewards
Looking for more Xylem style investment ideas?
Do not stop your research with Xylem alone, widen your watchlist using focused screens that surface different types of opportunities across quality, income, and value.
- Target resilient balance sheets and cash flow strength by reviewing the list of solid balance sheet and fundamentals (23 results). These companies may be better able to handle tougher conditions without placing as much stress on their finances.
- Pursue income-focused opportunities through the 7 dividend fortresses. This can help highlight higher yielding companies with an emphasis on payment strength.
- Hunt for potential mispricing with the 30 high quality undervalued stocks. This may flag stocks trading below internally assessed worth before the wider market responds.
This article by Simply Wall St is general in nature. We provide commentary based on historical data and analyst forecasts only using an unbiased methodology and our articles are not intended to be financial advice. It does not constitute a recommendation to buy or sell any stock, and does not take account of your objectives, or your financial situation. We aim to bring you long-term focused analysis driven by fundamental data. Note that our analysis may not factor in the latest price-sensitive company announcements or qualitative material. Simply Wall St has no position in any stocks mentioned.
Have feedback on this article? Concerned about the content? Get in touch with us directly. Alternatively, email editorial-team@simplywallst.com