
Navitas Petroleum (TASE:NVPT) Steps Into South Africa As Valuation Questions Linger
Navitas Petroleum steps into South African operatorship
Navitas Petroleum Limited Partnership (TASE:NVPT) has taken over a 37.5% working interest and operatorship of Block 1 CBK offshore South Africa, reshaping its project mix and future exploration responsibilities.
Recent trading has been choppy for Navitas Petroleum, with the share price down 9.28% over the past 30 days and 2.36% over the past week. However, the 17.21% 1-year total shareholder return and very large 5-year total shareholder return suggest longer term momentum has still been strong, even as investors reassess risk around new projects like Block 1 CBK.
Scan beyond Navitas Petroleum and size up other offshore and energy producers with resilient balance sheets using our hand-picked list of list of solid balance sheet and fundamentals (198 results).
Navitas Petroleum now runs a bigger, more complex portfolio after stepping in as operator of Block 1 CBK. The business appears strong based on recent returns, but is the current unit price giving you a fair entry for that mix of risks?
Price-to-earnings of 17x for Navitas Petroleum: Is it justified?
On a simple yardstick, Navitas Petroleum trades on a P/E of 17x, which lines up below the 22x peer average but above the 12.1x Asian oil and gas group figure, so the current ₪124.2 unit price reflects a mixed valuation signal depending on which yardstick you prefer.
The P/E ratio compares what you pay per unit to the partnership's earnings per unit. For a producer like Navitas Petroleum, this measure often reflects what the market is willing to pay today for current profitability when future growth forecasts are unclear or patchy.
Profitability arrived only in the past year and earnings quality is influenced by a high level of non cash items. This means the 17x multiple is being placed on a relatively fresh and somewhat complex earnings base rather than a long, stable record. That setup can indicate investors are accepting this valuation while they weigh the impact of debt, cash generation and the new South African operatorship on future earnings power.
Against peers, a 17x P/E looks cheaper than the 22x average for similar companies, which points to some discount relative to that group. Yet it still represents a richer tag than the 12.1x Asian oil and gas industry level where the market is assigning a lower price for each unit of earnings.
See what the numbers say about this price — find out in our valuation breakdown.
Result: Price-to-earnings of 17x (ABOUT RIGHT)
Still, the fresh profitability at Navitas Petroleum and its new South African operatorship both rely on projects where earnings can swing sharply if development or commodity conditions shift.
Find out about the key risks to this Navitas Petroleum Limited Partnership narrative.
Another view on Navitas Petroleum’s valuation
The P/E story says Navitas Petroleum is reasonably priced next to peers. Our DCF model pulls in a different direction. At ₪124.2 per unit compared to an estimated future cash flow value of ₪61.29, the units screen as overvalued on this framework. Which lens do you trust more for a project heavy producer?
Look into how the SWS DCF model arrives at its fair value.
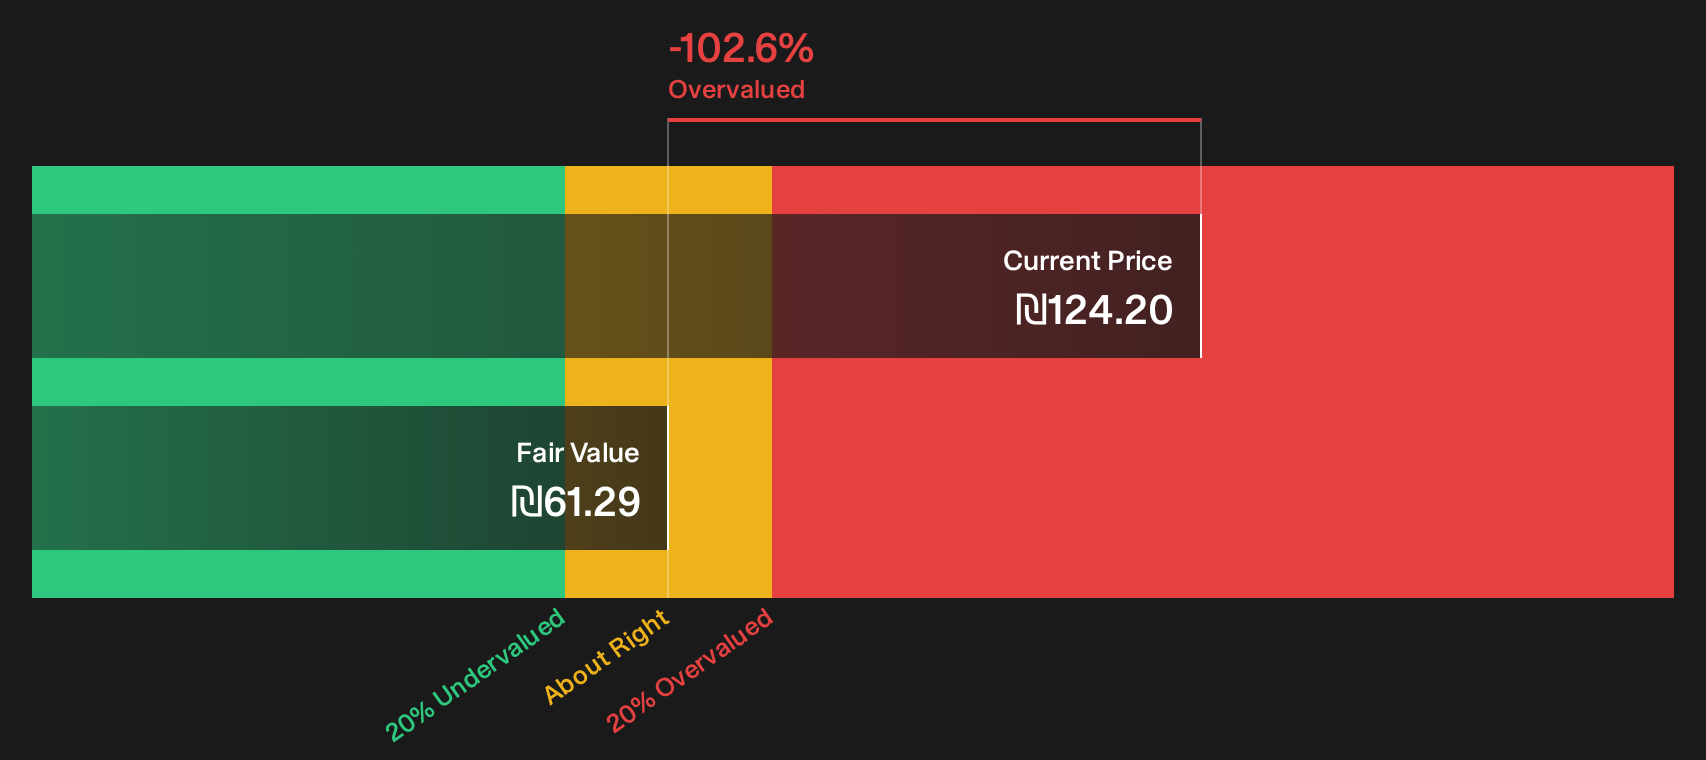
Simply Wall St performs a discounted cash flow (DCF) on every stock in the world every day (check out Navitas Petroleum Limited Partnership for example). We show the entire calculation in full. You can track the result in your watchlist or portfolio and be alerted when this changes, or use our stock screener to discover 172 high quality undervalued stocks. If you save a screener we even alert you when new companies match - so you never miss a potential opportunity.
Next Steps
Mixed signals on Navitas Petroleum's valuation and project risk can feel messy, so move quickly, review the underlying data for yourself, and weigh the 1 key reward and 3 important warning signs.
Looking for more Navitas Petroleum investment ideas?
If Navitas Petroleum has sharpened your focus on risk, return and price, do not stop here. Broaden your watchlist today and give yourself more options.
- Target resilient balance sheets and cleaner fundamentals by screening for a list of solid balance sheet and fundamentals (198 results) that can handle tougher conditions without blowing up your risk profile.
- Hunt for quality at a discount by scanning a 172 high quality undervalued stocks where strong cash flows meet more modest pricing than the broader market is offering today.
- Build a steadier income stream by checking a 161 dividend fortresses that focuses on higher yields while still accounting for financial strength and payout history.
This article by Simply Wall St is general in nature. We provide commentary based on historical data and analyst forecasts only using an unbiased methodology and our articles are not intended to be financial advice. It does not constitute a recommendation to buy or sell any stock, and does not take account of your objectives, or your financial situation. We aim to bring you long-term focused analysis driven by fundamental data. Note that our analysis may not factor in the latest price-sensitive company announcements or qualitative material. Simply Wall St has no position in any stocks mentioned.
Have feedback on this article? Concerned about the content? Get in touch with us directly. Alternatively, email editorial-team@simplywallst.com