
Iron Mountain (IRM) Leans On Data Center Growth, Is The 19% Undervalued View Enough?
Iron Mountain (IRM) trades around US$118 after recent moves that left the share price down over the past month and past 3 months, despite positive multi-year total return figures and ongoing revenue and net income growth.
Recent trading paints a mixed picture for Iron Mountain. The share price has climbed 41.91% year to date; however, the 30 day and 90 day share price returns of 3.19% and 9.54% respectively indicate momentum is cooling, even as the 1 year and multi year total shareholder returns remain strong.
Scan beyond Iron Mountain and size up other income-focused real estate plays through our hand picked list of 7 dividend fortresses for potential yield and resilience.
Iron Mountain now trades well below both analyst targets and one intrinsic value estimate, creating a wide gap between price and models. Is that a signal of opportunity or a warning about stretched expectations?
Most Popular Narrative: 19% Undervalued
Against Iron Mountain's last close at $118.13, the most followed narrative points to a fair value of $146.10. This view leans heavily on long run cash flow assumptions and the durability of its data center and digital services shift.
The highly fragmented market for Asset Life Cycle Management and data center decommissioning presents a significant runway for further organic and cross-sell growth, as Iron Mountain leverages its global footprint and trusted reputation, which should support long-term revenue and EBITDA acceleration.
See why 48 investors see Iron Mountain as 19% undervalued.
Result: Fair Value of $146.10 (UNDERVALUED)
Still, the bullish Iron Mountain narrative leans on heavy data center investment and higher leverage, which could bite if AI related demand or refinancing conditions disappoint.
Find out about the key risks to this Iron Mountain narrative.
Another View: Iron Mountain Through Earnings Multiples
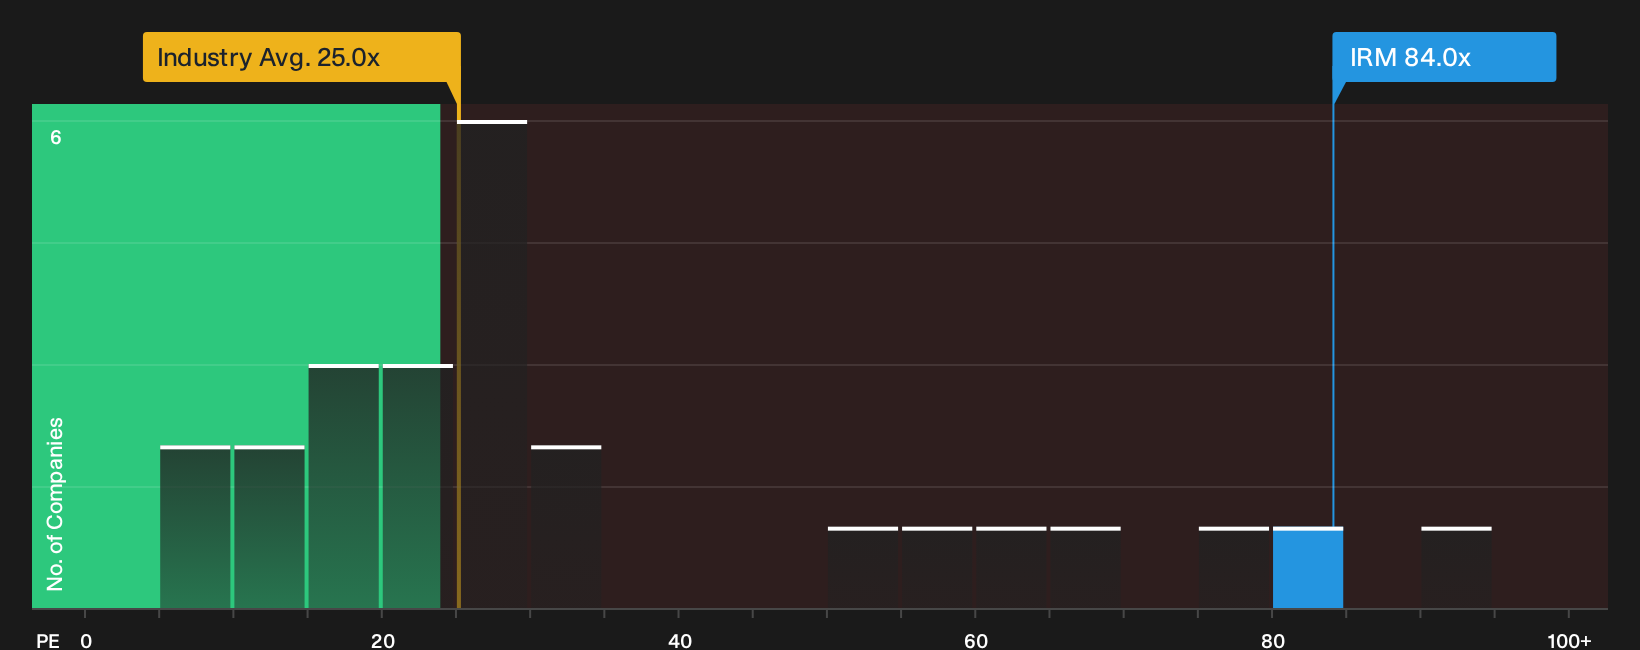
Iron Mountain might look cheap on intrinsic value models, with the SWS view pointing to a future cash flow value of $175.63 against a $118.13 price. The P/E picture tells a very different story. The stock trades on 84x earnings versus a peer average of 17.2x and a fair ratio of 42.3x, which suggests a rich valuation if profitability or growth expectations slip.
This kind of gap can work either way for investors. If earnings progress stalls or sentiment cools, a move toward that 42.3x fair ratio could mean a lot of downside without any change in profits. If you want a closer look at how the current price stacks up against those earnings based yardsticks, See what the numbers say about this price — find out in our valuation breakdown..
Next Steps
Mixed messages around Iron Mountain's value story can spark debate, so move fast, review the full data set, and weigh both sides through 4 key rewards and 4 important warning signs.
Looking for more investment ideas beyond Iron Mountain?
If Iron Mountain has sharpened your focus on pricing and risk, do not stop here. Use the screener to surface fresh ideas that fit your style.
- Target potential mispricings by scanning our 29 high quality undervalued stocks that combine quality fundamentals with compressed market expectations.
- Shield your portfolio from shocks by reviewing a 30 resilient stocks with low risk scores that scores well on financial strength and volatility.
- Get ahead of the crowd by filtering for a 16 high quality undiscovered gems with solid underlying metrics before attention catches up.
This article by Simply Wall St is general in nature. We provide commentary based on historical data and analyst forecasts only using an unbiased methodology and our articles are not intended to be financial advice. It does not constitute a recommendation to buy or sell any stock, and does not take account of your objectives, or your financial situation. We aim to bring you long-term focused analysis driven by fundamental data. Note that our analysis may not factor in the latest price-sensitive company announcements or qualitative material. Simply Wall St has no position in any stocks mentioned.
Have feedback on this article? Concerned about the content? Get in touch with us directly. Alternatively, email editorial-team@simplywallst.com