
3 Indian Penny Stocks With P E Under 8
Indian inflation pressures are building again as food, fuel and import costs bite, which can punish weaker balance sheets and reward businesses that keep their finances tight. That is where financially robust penny stocks come in. Investors can gain exposure to early stage growth stories, but with a focus on cleaner accounts and tighter discipline. This article highlights three such Indian penny stocks filtered for stronger financial health.
The three stocks covered next are only a small sample of the opportunities that clear this financial health filter. The full screen surfaces 118 more Indian penny stocks that share similar balance sheet strength and early stage potential. To go straight to the complete Financially Fit Penny Stocks list and identify and analyze your own high conviction ideas, head into the Financially Fit Penny Stocks screener.
Spacenet Enterprises India (NSEI:SPCENET)
Spacenet Enterprises India runs a mix of commodity trading and IT services, including TradFi tools for structured trade and commodity markets that fit the Financially Fit Penny Stocks theme. Services income was ₹1,075 million and trading revenue ₹827 million. The stock carries a market value of about ₹1.87 billion.
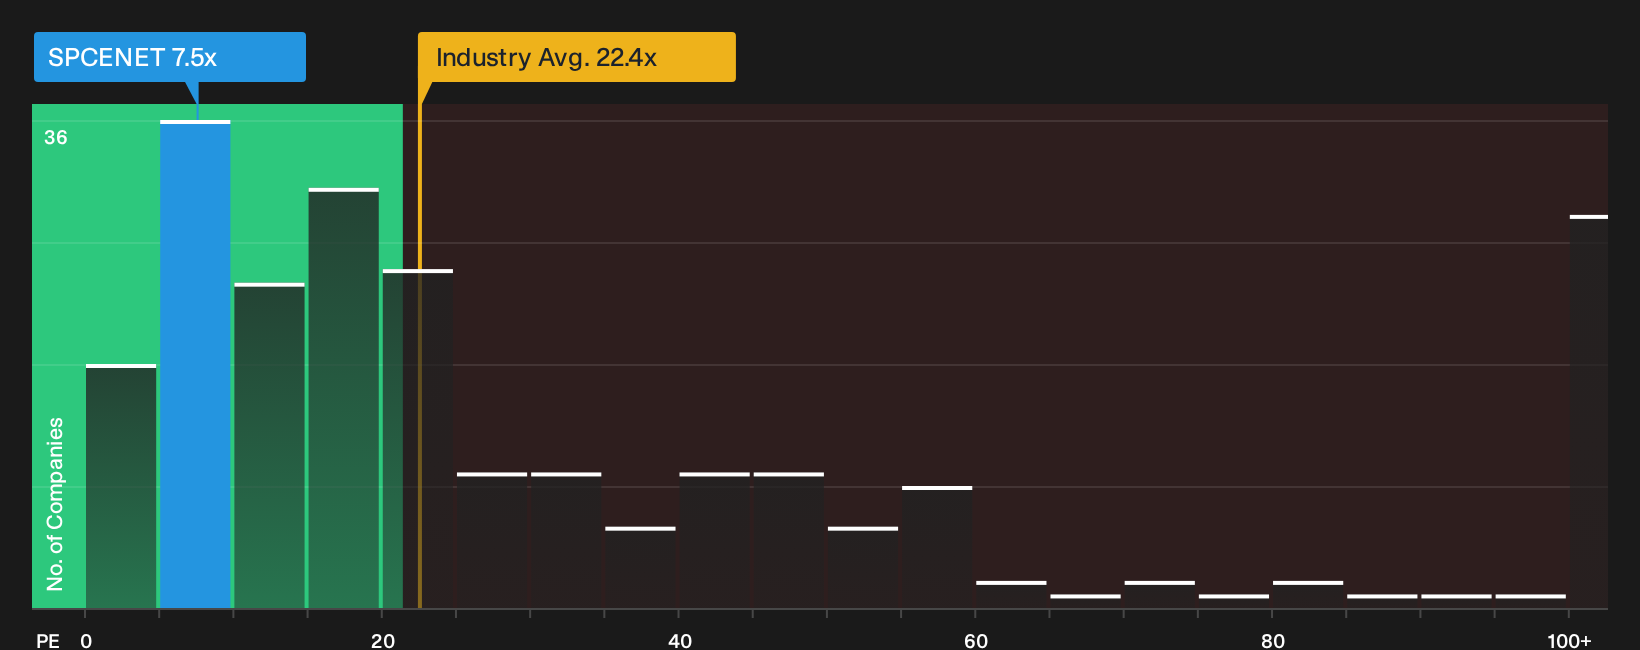
Spacenet Enterprises India pairs its TradFi commodity finance tools with a low 7.5x P/E and 13.2% net margins. This combination is unusual for a penny stock screened for financial health. Recent earnings and a quality label on profits provide context for that profile. However, the outlook is sensitive to how one currently unseen funding pressure develops.
That hidden funding question is the hinge for Spacenet Enterprises India, so review the 2 key rewards and 2 important warning signs to see whether current pricing reflects that tension or not.
Swasti Vinayaka Art and Heritage (BSE:512257)
Swasti Vinayaka Art and Heritage manufactures jewelry and carved precious and semi-precious stone pieces in Mumbai, aligning with the Financially Fit Penny Stocks focus on smaller artisan businesses. The stock has a market value of about ₹303.3 million.
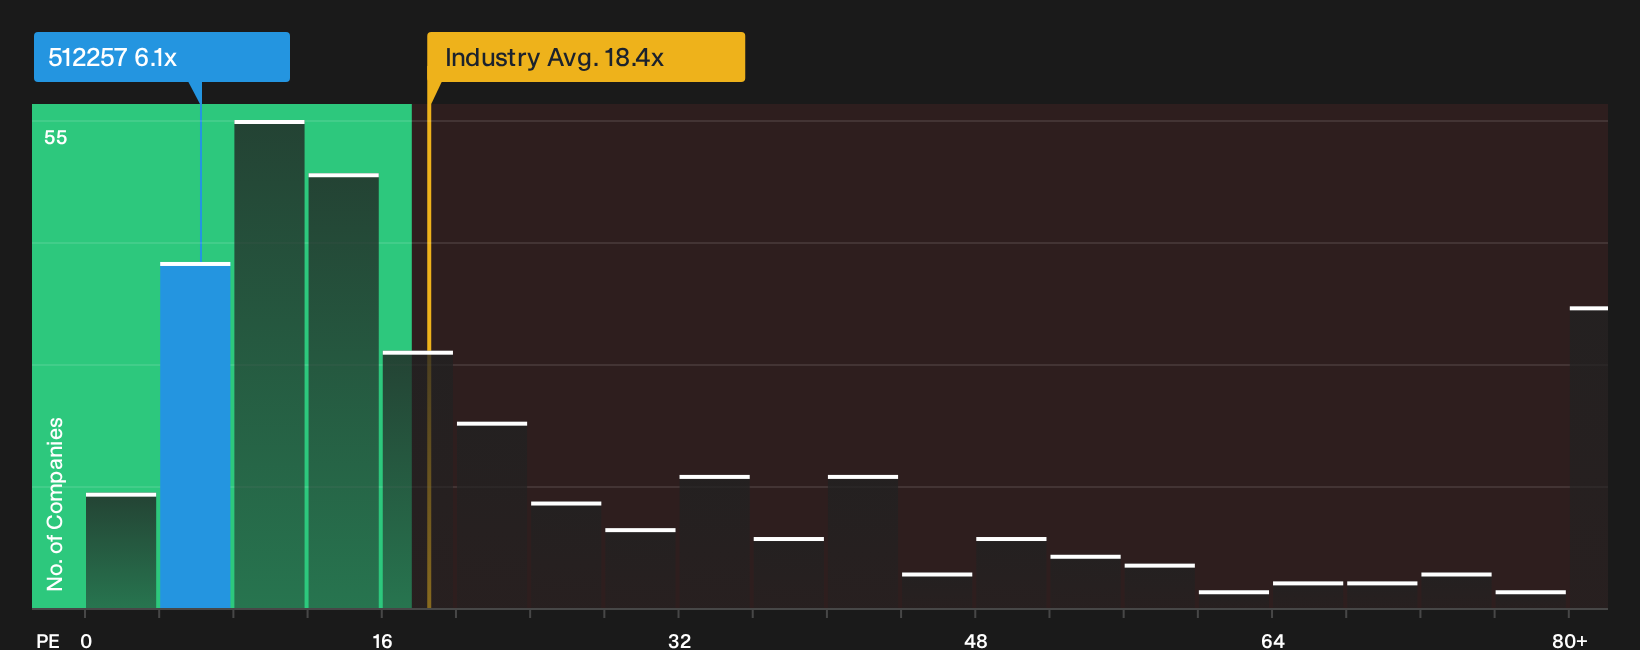
Swasti Vinayaka Art and Heritage currently trades at a 6.1x P/E with a 19.1% net margin and reported earnings growth of 35.2% on a small base. This aligns with the screener’s criteria for financially healthier penny stocks. Investors can review that profitability profile alongside one unresolved funding reliance that may affect how durable those margins appear.
That funding reliance could be the swing factor. To see whether Swasti Vinayaka Art and Heritage’s valuation is masking something or not, head to the 2 key rewards and 1 important warning sign.
Shangar Décor (BSE:540259)
Shangar Décor runs event decoration and catering across pre-wedding, wedding, corporate and religious functions, giving it a direct link to the Financially Fit Penny Stocks theme through service based revenue. It generated ₹261 million from its decoration division in India and has a market value of about ₹108 million.
For a penny stock, Shangar Décor combines a 5.3x P/E with 143.7% earnings growth over the past year and improving net margins at 7.8%. That mix of low valuation, higher profitability momentum than the broader Consumer Services sector and a refreshed board highlights the potential impact when revenue scale aligns with the next phase of demand for its event services.
That next phase of demand is where the real story for Shangar Décor may start to accelerate. Review the analysis report for Shangar Décor to see what the headline numbers are not showing yet.

Curious About What You Might Be Missing?
Fresh ideas move first. By the time every stock is on screens, early momentum can be gone and prices flying. Scan under the radar for now and act while opportunities are still developing.
- Spot resilient balance sheets before they hit mainstream screens by running the list of solid balance sheet and fundamentals (197 results) while the best candidates are still quietly building momentum.
- Track real income streams and compounding payouts using the 159 dividend fortresses so you are not caught chasing yields after prices have already broken out.
- Position around the next leg of electrification by reviewing the 17 top copper producer stocks while long term demand stories are still being priced cautiously.
This article by Simply Wall St is general in nature. We provide commentary based on historical data and analyst forecasts only using an unbiased methodology and our articles are not intended to be financial advice. It does not constitute a recommendation to buy or sell any stock, and does not take account of your objectives, or your financial situation. We aim to bring you long-term focused analysis driven by fundamental data. Note that our analysis may not factor in the latest price-sensitive company announcements or qualitative material. Simply Wall St has no position in any stocks mentioned.
Have feedback on this article? Concerned about the content? Get in touch with us directly. Alternatively, email editorial-team@simplywallst.com