
Is Seiko Group (TSE:8050) Undervalued As FTSE All World Index Inclusion Draws Focus?
Seiko Group (TSE:8050) was recently added to the FTSE All-World Index in USD terms, a move that can influence trading as index-tracking funds and institutions adjust their portfolios.
Recent trading has been lively for Seiko Group, with the share price up 1.55% over the last day and 2.61% across the past week, even though the 30 day share price return declined 6.74%. The 90 day gain of 29.21% and a 5 year total shareholder return of nearly 9x indicate that momentum has been building rather than fading around the time of its FTSE All World Index inclusion.
Compare Seiko Group's index-driven momentum with a curated group of resilient companies screened for balance sheet strength and fundamentals using our list of solid balance sheet and fundamentals (21 results).
Seiko Group now trades at ¥9,820 while analyst targets and intrinsic estimates sit higher, highlighting a clear valuation gap. How narrow is the margin between the current price and what models suggest is fair?
Price-to-Earnings of 29.9x: Is it justified?
On simple numbers, Seiko Group trades on a P/E of 29.9x, which is rich compared with both its own fair ratio and sector peers, despite the DCF hinting at a valuation gap. The last close at ¥9,820 sits below an SWS DCF model estimate of ¥11,344.96, yet the earnings multiple presents a very different picture.
The P/E ratio measures how much investors are paying today for each unit of current earnings. For a consumer durables group like Seiko Group, which mixes luxury watches, devices and system solutions, that metric helps indicate how much of the price is tied to expectations about future profitability rather than what has already been delivered.
Here the valuation appears stretched. The stock trades on 29.9x earnings, compared with a peer average of 16.7x and a JP Luxury industry average of 15.6x, suggesting the market is paying a steep premium for its earnings profile. The estimated fair P/E of 22.3x is also far lower than the current level, which is a multiple the market could eventually move closer to if sentiment cools.
Explore the SWS fair ratio for Seiko Group.
Result: Preferred multiple of 29.9x price-to-earnings (OVERVALUED)
Still, a premium P/E can lose support quickly if Seiko Group's revenue growth of 6.8% or net income growth of 15.3% slows, or if sector sentiment turns.
Find out about the key risks to this Seiko Group narrative.
Another View: Seiko Group Through The DCF Lens
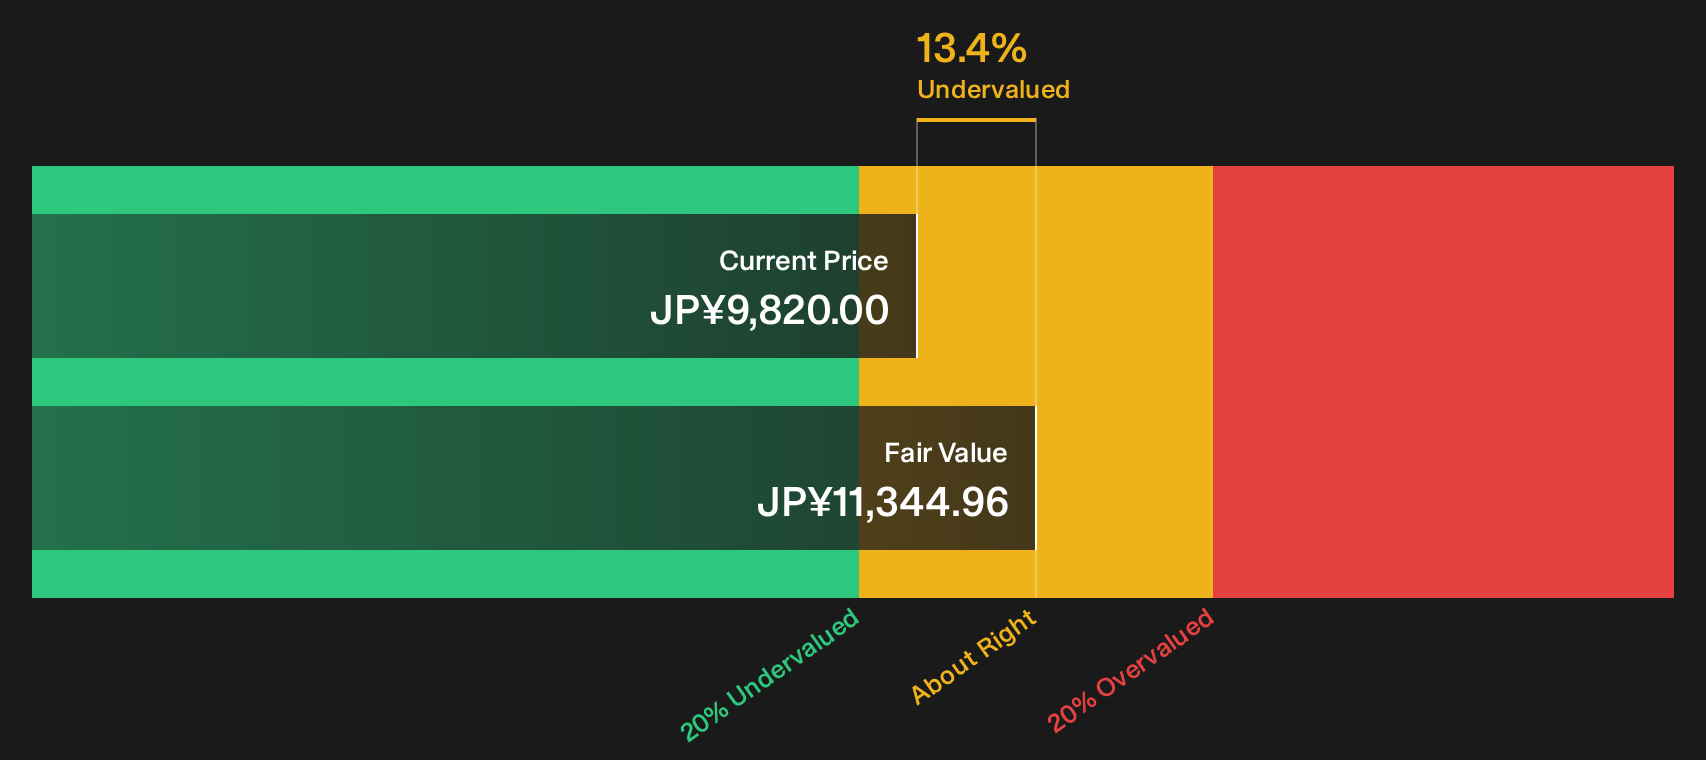
The earnings multiple paints Seiko Group as expensive, but the SWS DCF model tells a different story. At ¥9,820 against an estimated future cash flow value of ¥11,344.96, the stock screens as undervalued by 13.4%. Which signal should matter more to you: the cash flows or the headline P/E?
Look into how the SWS DCF model arrives at its fair value.
Simply Wall St performs a discounted cash flow (DCF) on every stock in the world every day (check out Seiko Group for example). We show the entire calculation in full. You can track the result in your watchlist or portfolio and be alerted when this changes, or use our stock screener to discover 17 high quality undervalued stocks. If you save a screener we even alert you when new companies match - so you never miss a potential opportunity.
Next Steps
Mixed signals around Seiko Group can easily pull you in two directions, so consider acting promptly, examine the full data set, and weigh both sides of the story by checking the balance of 3 key rewards and 1 important warning sign.
Looking for more Seiko Group style investment ideas?
If you want more potential opportunities beyond Seiko Group, use the Simply Wall Street Screener to uncover targeted ideas that fit your approach.
- Target potential mispricing by scanning for companies flagged as having quality fundamentals at compelling valuations through our 17 high quality undervalued stocks.
- Strengthen your income focus by zeroing in on businesses with substantial yields and resilient payout histories using the dedicated 14 dividend fortresses.
- Prioritise capital protection by filtering for companies assessed with lower risk scores and steadier profiles via the focused 21 resilient stocks with low risk scores.
This article by Simply Wall St is general in nature. We provide commentary based on historical data and analyst forecasts only using an unbiased methodology and our articles are not intended to be financial advice. It does not constitute a recommendation to buy or sell any stock, and does not take account of your objectives, or your financial situation. We aim to bring you long-term focused analysis driven by fundamental data. Note that our analysis may not factor in the latest price-sensitive company announcements or qualitative material. Simply Wall St has no position in any stocks mentioned.
Have feedback on this article? Concerned about the content? Get in touch with us directly. Alternatively, email editorial-team@simplywallst.com