
Cricut (CRCT) Rebound Puts Valuation Debate Back In Focus
Cricut (CRCT) has drawn fresh attention after recent trading left the share price at $5.65. The stock has shown mixed returns over the past month, the past three months, and the prior year.
Recent moves suggest short-term momentum for Cricut, with a 90-day share price return of 29.89% and a year-to-date share price return of 16.98%. However, the 1-year total shareholder return declined 13.75%, pointing to a rebound that is still rebuilding confidence.
Compare Cricut's recent rebound with other consumer-focused stocks showing similar patterns by scanning our hand picked 17 high quality undiscovered gems for ideas that might not yet be widely followed.
Cricut now trades around $5.65 while analyst targets and intrinsic value estimates point in different directions. Does fair value lean closer to Wall Street's cooler view or to the richer implied valuation range?
Price-to-Earnings of 13.5x: Is it justified?
Cricut currently trades on a P/E of 13.5x, which sets a clear reference point for the $5.65 share price against its recent earnings power.
The P/E ratio compares what you pay for each $1 of earnings, so it is a quick way to see how the market values Cricut relative to its profit profile. For a consumer durables business that reports high quality earnings and a Return on Equity of 23.8%, this metric becomes an important shorthand for how much investors are willing to pay for those profits.
Over the past year, Cricut's earnings grew 22.1% and its net profit margin improved from 10.1% to 12.7%, even as earnings over the past 5 years declined 17.8% per year. That mix of recent profit recovery and weaker multi year history helps explain why the current P/E of 13.5x is higher than the peer average of 9.4x and also slightly above the broader US Consumer Durables industry average of 13x. The market is attaching a richer valuation than direct peers, and even a premium to the sector, which indicates that investors are already paying up for the current level of profitability.
See what the numbers say about this price — find out in our valuation breakdown.
Result: Price-to-Earnings of 13.5x (OVERVALUED).
Still, Cricut relies heavily on hardware demand and consumer spending. As a result, weaker unit shipments or softer retailer orders could quickly pressure that premium P/E argument.
Find out about the key risks to this Cricut narrative.
Another view on Cricut's value
The P/E screen portrays Cricut as expensive, yet the SWS DCF model points in the opposite direction. At $5.65, the stock sits about 56.7% below an estimated future cash flow value of $13.03, which frames the current price as undervalued rather than stretched.
That kind of gap raises a simple question: Is the market correctly discounting Cricut's long term cash generation, or is this a valuation mismatch that eventually closes for patient investors?
Look into how the SWS DCF model arrives at its fair value.
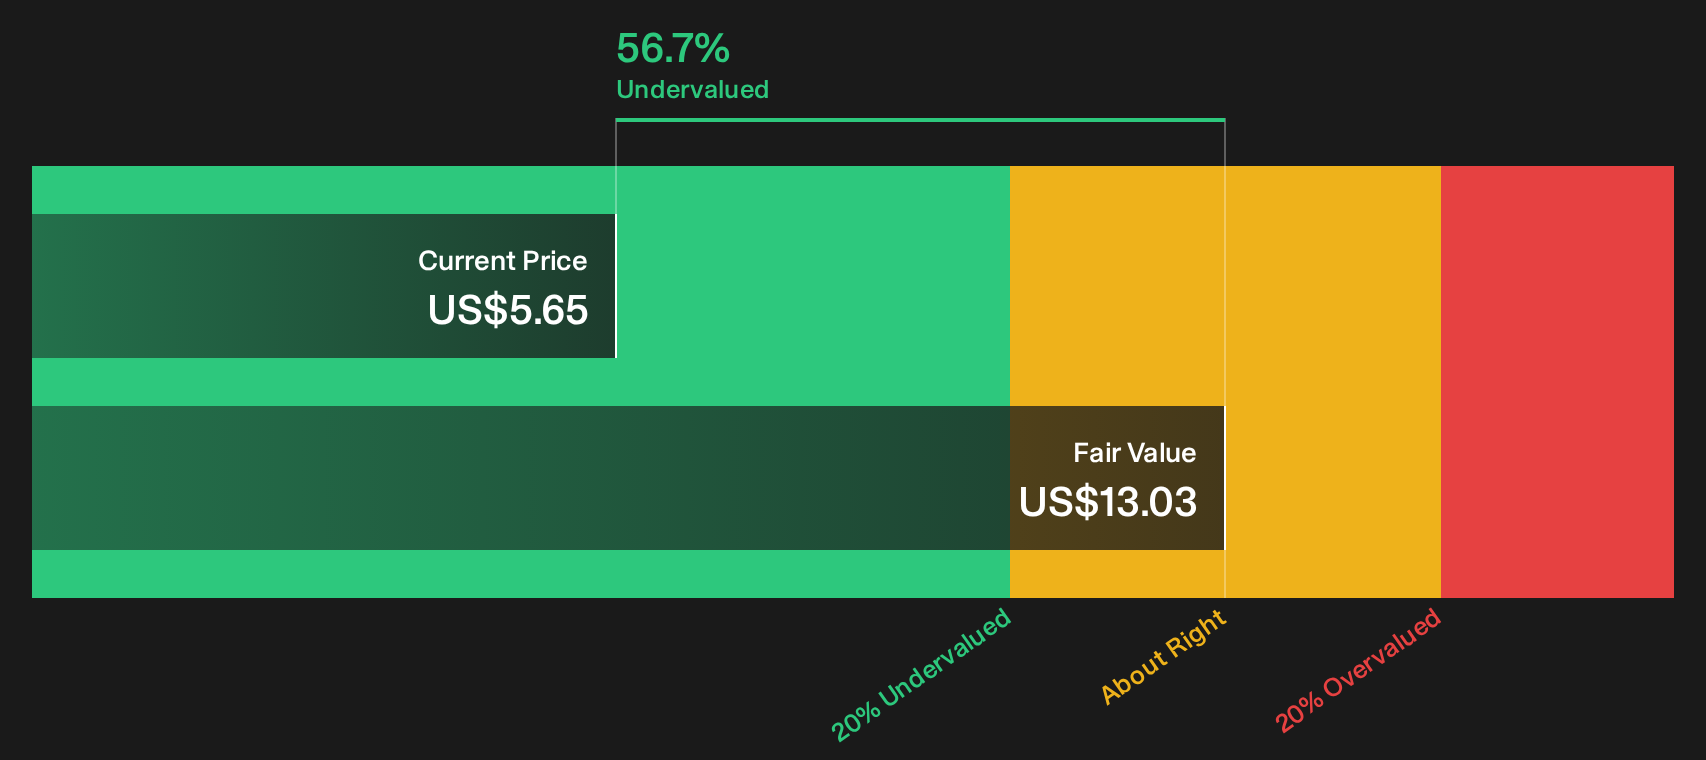
Simply Wall St performs a discounted cash flow (DCF) on every stock in the world every day (check out Cricut for example). We show the entire calculation in full. You can track the result in your watchlist or portfolio and be alerted when this changes, or use our stock screener to discover 30 high quality undervalued stocks. If you save a screener we even alert you when new companies match - so you never miss a potential opportunity.
Next Steps
With sentiment split between premium P/E signals and discounted cash flow estimates, it makes sense to move fast and check the details firsthand so your view is grounded in hard numbers rather than headlines. To balance both sides of the Cricut story, make time to review the 2 key rewards and 3 important warning signs.
Looking for more Cricut investment ideas?
If Cricut has you thinking more broadly about opportunities, do not stop here. Use curated screens to quickly surface other stocks that match your preferences.
- Target potential mispricings by scanning the 30 high quality undervalued stocks that combine solid financials with compressed expectations.
- Prioritise resilience by filtering for 30 resilient stocks with low risk scores that aim to keep portfolio swings more controlled.
- Spot less crowded opportunities by combing through a 17 high quality undiscovered gems before they attract wider attention.
This article by Simply Wall St is general in nature. We provide commentary based on historical data and analyst forecasts only using an unbiased methodology and our articles are not intended to be financial advice. It does not constitute a recommendation to buy or sell any stock, and does not take account of your objectives, or your financial situation. We aim to bring you long-term focused analysis driven by fundamental data. Note that our analysis may not factor in the latest price-sensitive company announcements or qualitative material. Simply Wall St has no position in any stocks mentioned.
Have feedback on this article? Concerned about the content? Get in touch with us directly. Alternatively, email editorial-team@simplywallst.com