
Why Elemental Royalty (TSX:ELE) Shares Climbed After Its Latest Update?
Elemental Royalty (TSX:ELE) has announced a wide ranging Orion portfolio acquisition, updated its 2026 gold equivalent ounce guidance, expanded its credit facility, and reshaped senior leadership. This gives investors several moving parts to weigh.
Elemental Royalty’s latest moves come after a strong run in the shares, with the CA$30.45 price reflecting a 90 day share price return of 36.12% and a year to date gain of 40.52%. The 3 year total shareholder return of 156.81% signals that momentum has been building over a longer stretch.
Scan how Elemental Royalty fits into the wider precious metals opportunity set by comparing it with our curated 36 elite gold producer stocks, which is also gearing portfolios toward royalty and producer exposure.
Elemental Royalty’s surge now sits against a packed backdrop of new streams, fresh guidance, increased debt capacity, and the return of its founder CEO. As you consider value next, are you paying for business change or a shift in sentiment?
Preferred Price-to-Sales of 19.6x: Is it justified?
Valuation for Elemental Royalty is already punchy, with the shares on a P/S ratio of 19.6x even after the recent run to CA$30.45. That sits against a peer group and broader Canadian Metals and Mining industry that trade at far lower sales multiples.
The P/S measure compares the value the market places on the equity to the most recent annual revenue, which for Elemental Royalty is CA$71.02m. For a royalty-focused precious metals business, investors often look at this metric when earnings are noisy or affected by one off items, because top line cash flows can give a cleaner feel for scale than short term profit swings.
Here, the gap is wide. Elemental Royalty’s 19.6x P/S is materially higher than the Canadian Metals and Mining industry average of 5.5x, and also ahead of the 6.7x peer average. That pricing implies the market is willing to pay a much richer tag per dollar of sales, even though earnings have recently been affected by a large one off loss of US$4.1m and net profit margin has moved from 14.4% to 4%.
Even with that premium, the internal fair P/S estimate of 22.2x suggests the current ratio is still below the level the SWS model points to as justified. That fair ratio is higher than where the shares trade today. This signals that the present multiple could move closer to that 22.2x reference point if the forecast revenue growth of 26.36% per year materialises as expected.
Explore the SWS fair ratio for Elemental Royalty.
Result: Price-to-sales of 19.6x (OVERVALUED)
Still, the Elemental Royalty story can break if new royalty deals fail to convert into higher revenue or if acquisition driven debt reduces financial flexibility.
Find out about the key risks to this Elemental Royalty narrative.
Another View on Elemental Royalty’s value
The picture shifts when you move from sales multiples to the SWS DCF model. On that framework, Elemental Royalty at CA$30.45 is trading well below an estimated future cash flow value of CA$140.78, which points to a very different read on what the equity could be worth.
That kind of gap raises practical questions. Is the P/S premium simply reflecting near term enthusiasm, or is the DCF leaning too heavily on optimistic long range cash flow assumptions?
Look into how the SWS DCF model arrives at its fair value.
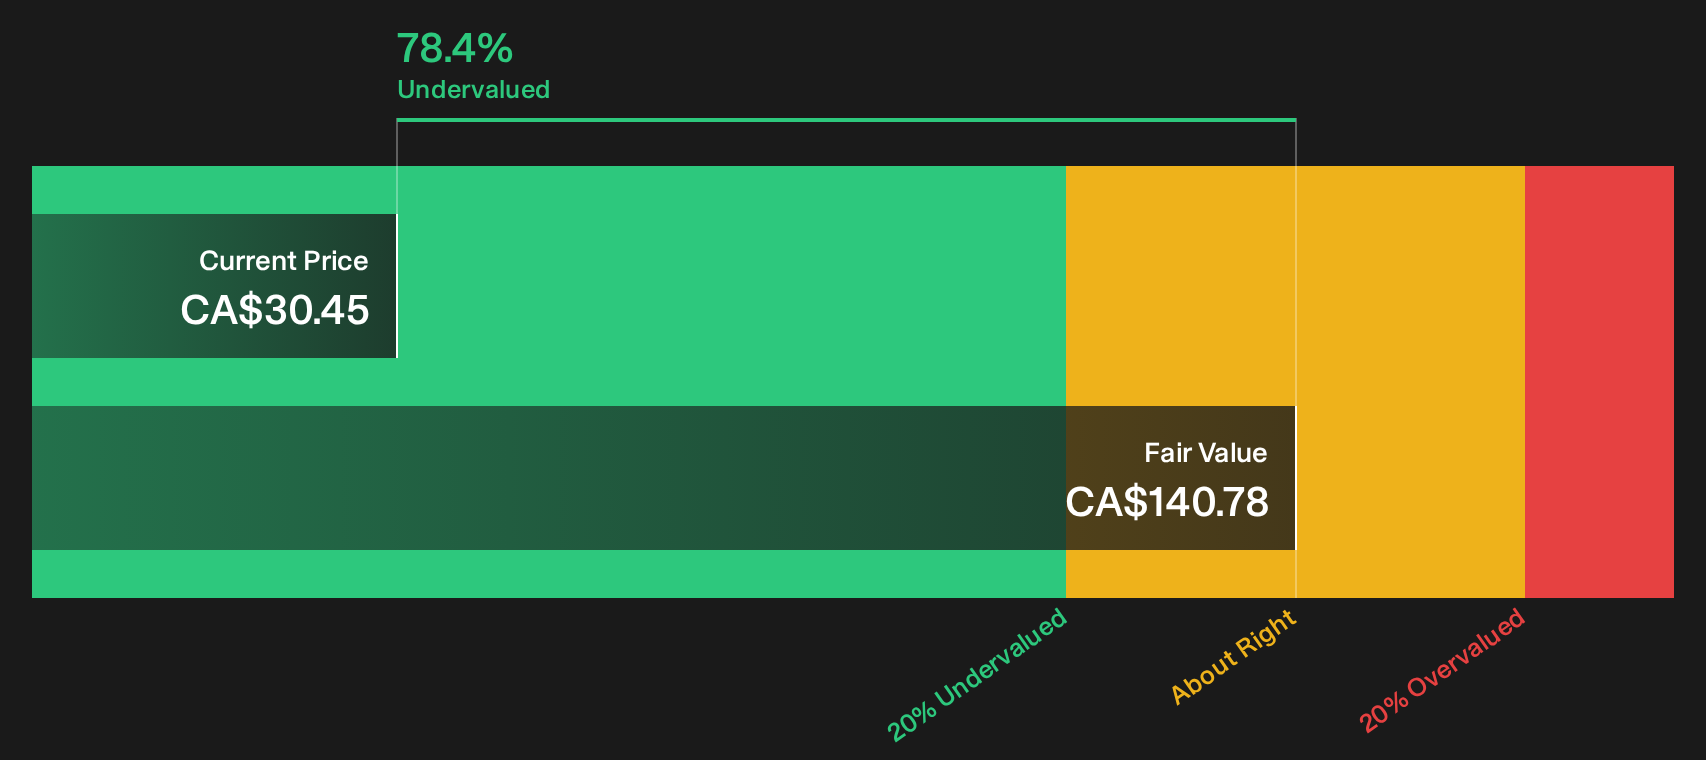
Simply Wall St performs a discounted cash flow (DCF) on every stock in the world every day (check out Elemental Royalty for example). We show the entire calculation in full. You can track the result in your watchlist or portfolio and be alerted when this changes, or use our stock screener to discover 6 high quality undervalued stocks. If you save a screener we even alert you when new companies match - so you never miss a potential opportunity.
Next Steps
Plenty in Elemental Royalty’s story can feel exciting or uncomfortable depending on your bias, so move fast, review the full data set carefully, and weigh the 2 key rewards and 3 important warning signs.
Looking for more Elemental Royalty sized ideas?
If Elemental Royalty has sparked fresh questions about where to deploy capital next, use the Simply Wall Street Screener to compare other opportunities with the same discipline.
- Target resilient balance sheets and steady fundamentals by scanning our list of solid balance sheet and fundamentals (7 results) that many investors overlook until conditions tighten.
- Hunt for potential value gaps with the 6 high quality undervalued stocks that filters for quality businesses trading at what may be compelling prices.
- Secure a stream of cash returns by reviewing the 1 dividend fortresses built around higher yielding companies with a focus on durability.
This article by Simply Wall St is general in nature. We provide commentary based on historical data and analyst forecasts only using an unbiased methodology and our articles are not intended to be financial advice. It does not constitute a recommendation to buy or sell any stock, and does not take account of your objectives, or your financial situation. We aim to bring you long-term focused analysis driven by fundamental data. Note that our analysis may not factor in the latest price-sensitive company announcements or qualitative material. Simply Wall St has no position in any stocks mentioned.
Have feedback on this article? Concerned about the content? Get in touch with us directly. Alternatively, email editorial-team@simplywallst.com