
Biohaven (BHVN) Gains Attention As Pipeline Hopes Meet A Big Fair Value Gap
Biohaven’s recent share move in context
Biohaven (BHVN) has drawn fresh attention after a recent price move, with the stock closing at $14.22 on 19 September 2026. Investors are weighing that level against the company’s clinical pipeline and ongoing losses.
Set against that fresh move, Biohaven’s 1-day share price return of 4.41% and 7-day share price return of 12.50% point to short term momentum building. However, the year to date share price return of 31.18% contrasts with a 1-year total shareholder return that is down 4.24% and a 3-year total shareholder return that is down 17.52%.
Scan how Biohaven’s recent move compares with other high potential biopharma names by using the hand picked 37 healthcare AI stocks that sit at the crossroads of drug development and advanced data science.
Biohaven now trades at a steep discount to both analyst targets and one intrinsic value estimate, yet the business still carries zero revenue and sizeable losses. Is the market simply cautious, or appropriately sceptical on valuation?
Price to book of 175.7x for Biohaven: is it justified?
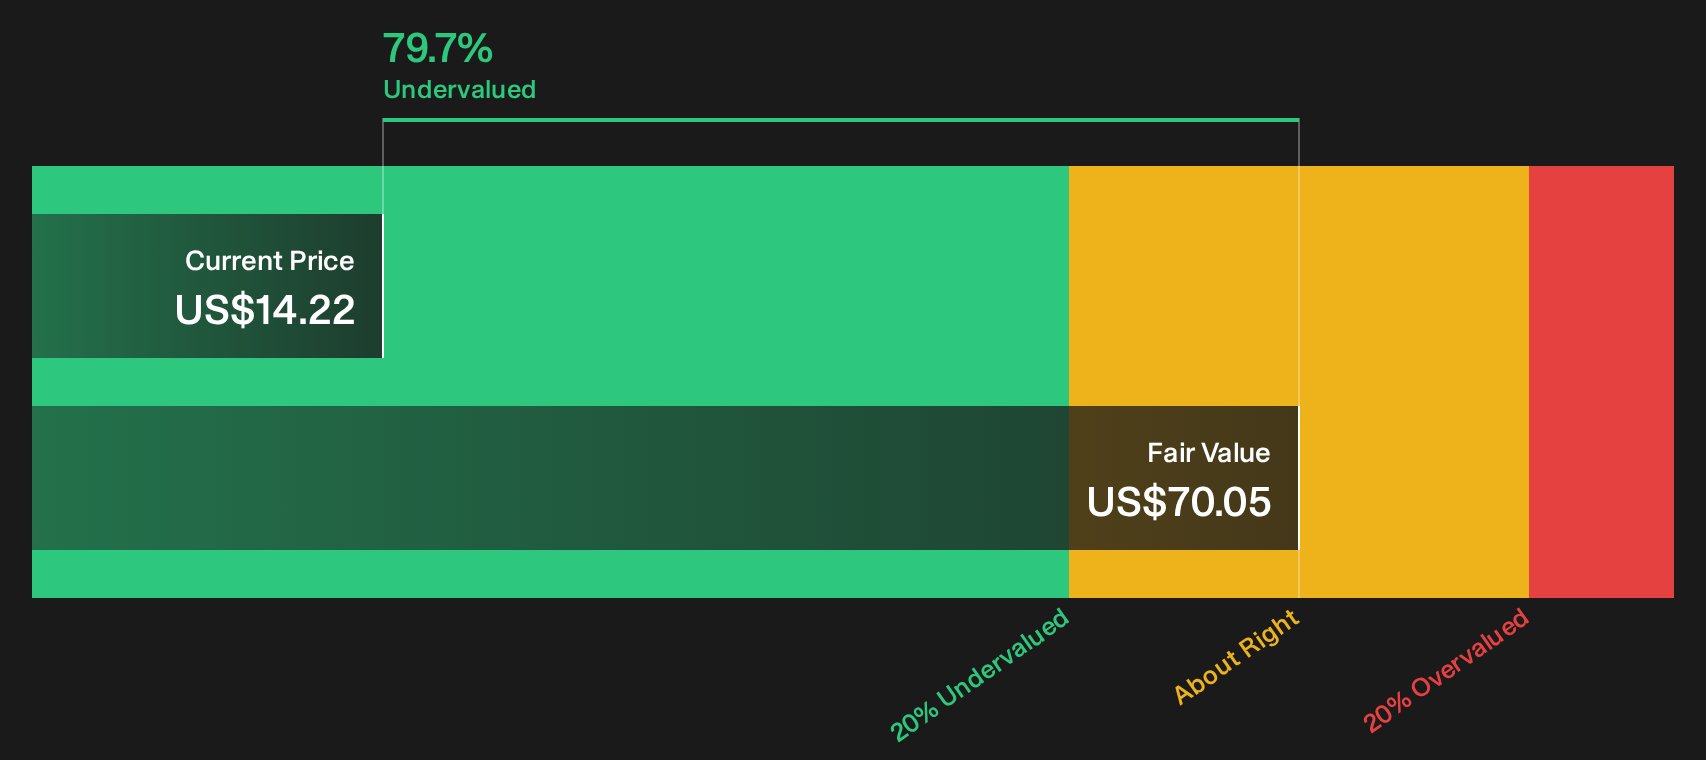
Valuation screens show a sharp contrast for Biohaven. Our DCF model points to a fair value of $70.05 per share while the stock most recently closed at $14.22 and the P/B ratio sits at 175.7x, far above both biotech peers and the wider industry.
The SWS DCF model estimates what a business might be worth by projecting its future cash flows then discounting those back to today using a required rate of return. It focuses on the cash the enterprise is expected to generate over time rather than current earnings or revenue, which can be less informative for a research stage biotech.
That approach is particularly relevant for Biohaven because the company currently reports no revenue and a net loss of $586.841m, and is forecast to remain unprofitable over the next 3 years. In this kind of early stage drug developer, investors often anchor expectations on pipeline potential and forecast growth. The model here implies the recent share price reflects a steep discount to those future cash flow estimates while still leaving material execution and funding risk on the table.
Biohaven also scores as "Good value" in the statements, described as trading 79.7% below this internal fair value estimate. At the same time it is flagged as expensive on a P/B basis versus both the US Biotechs industry average of 2.2x and a peer group average of 12.4x. The DCF result therefore sits alongside a capital structure that includes higher risk external borrowing, less than one year of cash runway, and recent shareholder dilution, which are all factors for investors to weigh when deciding how much weight to place on that theoretical value.
Look into how the SWS DCF model arrives at its fair value.
Result: DCF Fair value of $70.05 (UNDERVALUED)
Still, the Biohaven story could be knocked off course if late stage trials disappoint or if ongoing losses force more aggressive funding on tougher terms.
Find out about the key risks to this Biohaven narrative.
Another view on Biohaven’s valuation
Price tags send a mixed message for Biohaven. The SWS DCF model points to a fair value of $70.05 per share versus the current $14.22 level, which screens as undervalued on future cash flow estimates even as the stock carries zero revenue and heavy losses. Does that gap signal opportunity or simply underline how much has to go right?
Look into how the SWS DCF model arrives at its fair value.
Simply Wall St performs a discounted cash flow (DCF) on every stock in the world every day (check out Biohaven for example). We show the entire calculation in full. You can track the result in your watchlist or portfolio and be alerted when this changes, or use our stock screener to discover 30 high quality undervalued stocks. If you save a screener we even alert you when new companies match - so you never miss a potential opportunity.
Next Steps
With Biohaven caught between discounted valuation models and real funding and trial risks, sentiment is clearly split. If you want to move beyond headlines and price targets, review both sides of the story by checking the 2 key rewards and 5 important warning signs.
Looking for more investment ideas beyond Biohaven?
If Biohaven has your attention, you may want to broaden your watchlist with other opportunities sourced from clear, rule based screens that can help you spot different risk reward setups.
- Scan a curated pool of companies that screen as mispriced on quality and value factors through the 30 high quality undervalued stocks.
- Focus on established businesses that pass the high yield and resilience filters in the 7 dividend fortresses.
- Identify companies with stronger balance sheets and fundamentals using the list of solid balance sheet and fundamentals (23 results).
This article by Simply Wall St is general in nature. We provide commentary based on historical data and analyst forecasts only using an unbiased methodology and our articles are not intended to be financial advice. It does not constitute a recommendation to buy or sell any stock, and does not take account of your objectives, or your financial situation. We aim to bring you long-term focused analysis driven by fundamental data. Note that our analysis may not factor in the latest price-sensitive company announcements or qualitative material. Simply Wall St has no position in any stocks mentioned.
Have feedback on this article? Concerned about the content? Get in touch with us directly. Alternatively, email editorial-team@simplywallst.com