
Is Chiyoda (TSE:6366) Undervalued As Its Shares Hover Around ¥700?
Chiyoda (TSE:6366) has come back into focus after its recent share price move, with the stock last closing at ¥700. That level is the basis for today’s look at how the business currently stacks up.
Recent trading hints at stabilising sentiment around Chiyoda, with a modest 7 day share price return of 1.01% sitting against a year to date share price decline of 16.07% and a 1 year total shareholder return of 75.00%. This suggests earlier optimism has cooled, while long term holders still sit on strong gains.
Compare Chiyoda’s recent swings with a curated set of infrastructure and engineering peers by scanning the 19 nuclear energy infrastructure stocks that are likely to benefit from similar project and capital spending cycles.
After a sharp run over the past year and a more hesitant patch in recent months, Chiyoda at ¥700 now poses a simple choice: Do you pay up today or wait for a cleaner value case to emerge?
Price-to-Earnings of 2.2x for Chiyoda: Is it justified?
On a simple earnings lens, Chiyoda at ¥700 looks inexpensive, with the stock trading on a P/E of 2.2x while still reflecting a 75.00% total shareholder return over the past year. That combination points to a market price that does not fully match the level of profitability the business is currently reporting.
The P/E ratio compares what investors are paying for each unit of profit that Chiyoda generates. For an engineering contractor with exposure to large gas, energy, and industrial projects, that metric gives a quick read on how much the market is willing to pay for today’s earnings stream given the cyclicality and project risk that come with this sector.
Here the gap is wide. Chiyoda trades at 2.2x earnings, which is well below both its peer average of 11.9x and the broader JP Construction industry on 11.1x. The stock also sits below an estimated fair P/E of 4.7x, a level the market could move toward if sentiment aligned more closely with the firm’s current return profile and recent earnings strength.
Explore the SWS fair ratio for Chiyoda.
Result: Price-to-Earnings of 2.2x (UNDERVALUED)
Still, the story around Chiyoda can change quickly if project pipelines slow further or if the recent annual declines in revenue and net income become more pronounced.
Find out about the key risks to this Chiyoda narrative.
Another view on Chiyoda’s value
Cheap earnings are only one lens. Our DCF model estimates Chiyoda’s future cash flows point to a value of ¥1,447.22 per share, which is well above the current ¥700 price and suggests the stock may be undervalued on this second yardstick as well. If both signals point in the same direction, what might still be worrying the market?
Look into how the SWS DCF model arrives at its fair value.
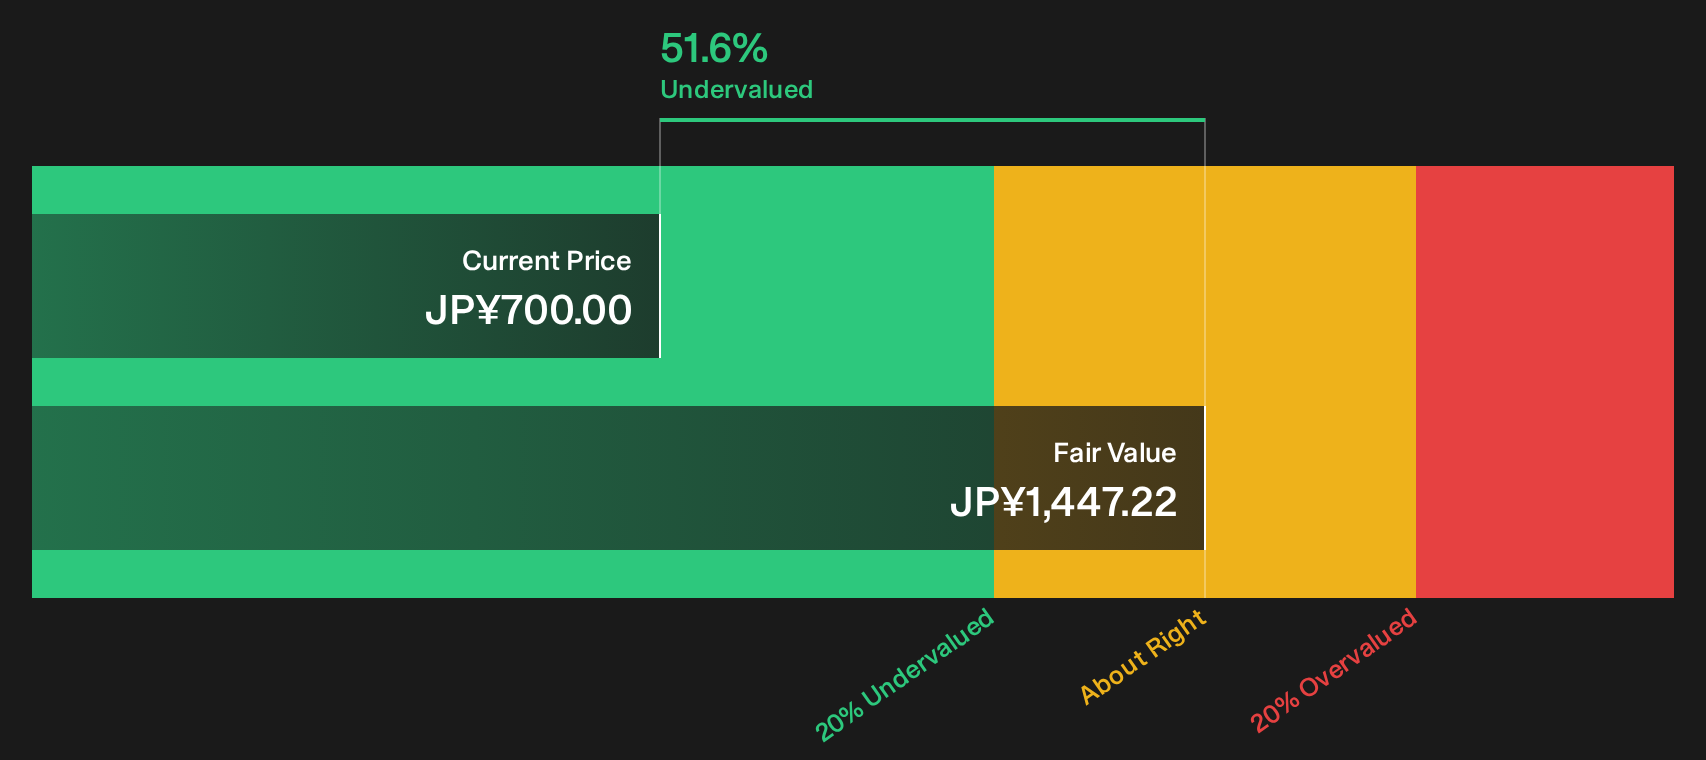
Simply Wall St performs a discounted cash flow (DCF) on every stock in the world every day (check out Chiyoda for example). We show the entire calculation in full. You can track the result in your watchlist or portfolio and be alerted when this changes, or use our stock screener to discover 17 high quality undervalued stocks. If you save a screener we even alert you when new companies match - so you never miss a potential opportunity.
Next Steps
Mixed signals around Chiyoda can be confusing, so act promptly, review the full picture for yourself, then weigh up the 3 key rewards and 2 important warning signs.
Looking for more investment ideas beyond Chiyoda?
If Chiyoda has your attention, this is the moment to widen the net. Fresh ideas now can save a lot of second guessing later.
- Target potential upside by scanning a focused set of undervalued opportunities using the 17 high quality undervalued stocks.
- Prioritise resilience first and stress test your portfolio with the 21 resilient stocks with low risk scores.
- Hunt for underfollowed potential by checking the 75 high quality undiscovered gems.
This article by Simply Wall St is general in nature. We provide commentary based on historical data and analyst forecasts only using an unbiased methodology and our articles are not intended to be financial advice. It does not constitute a recommendation to buy or sell any stock, and does not take account of your objectives, or your financial situation. We aim to bring you long-term focused analysis driven by fundamental data. Note that our analysis may not factor in the latest price-sensitive company announcements or qualitative material. Simply Wall St has no position in any stocks mentioned.
Have feedback on this article? Concerned about the content? Get in touch with us directly. Alternatively, email editorial-team@simplywallst.com