
How Investors May Respond To Texas Instruments (TXN) 7% Dividend Raise
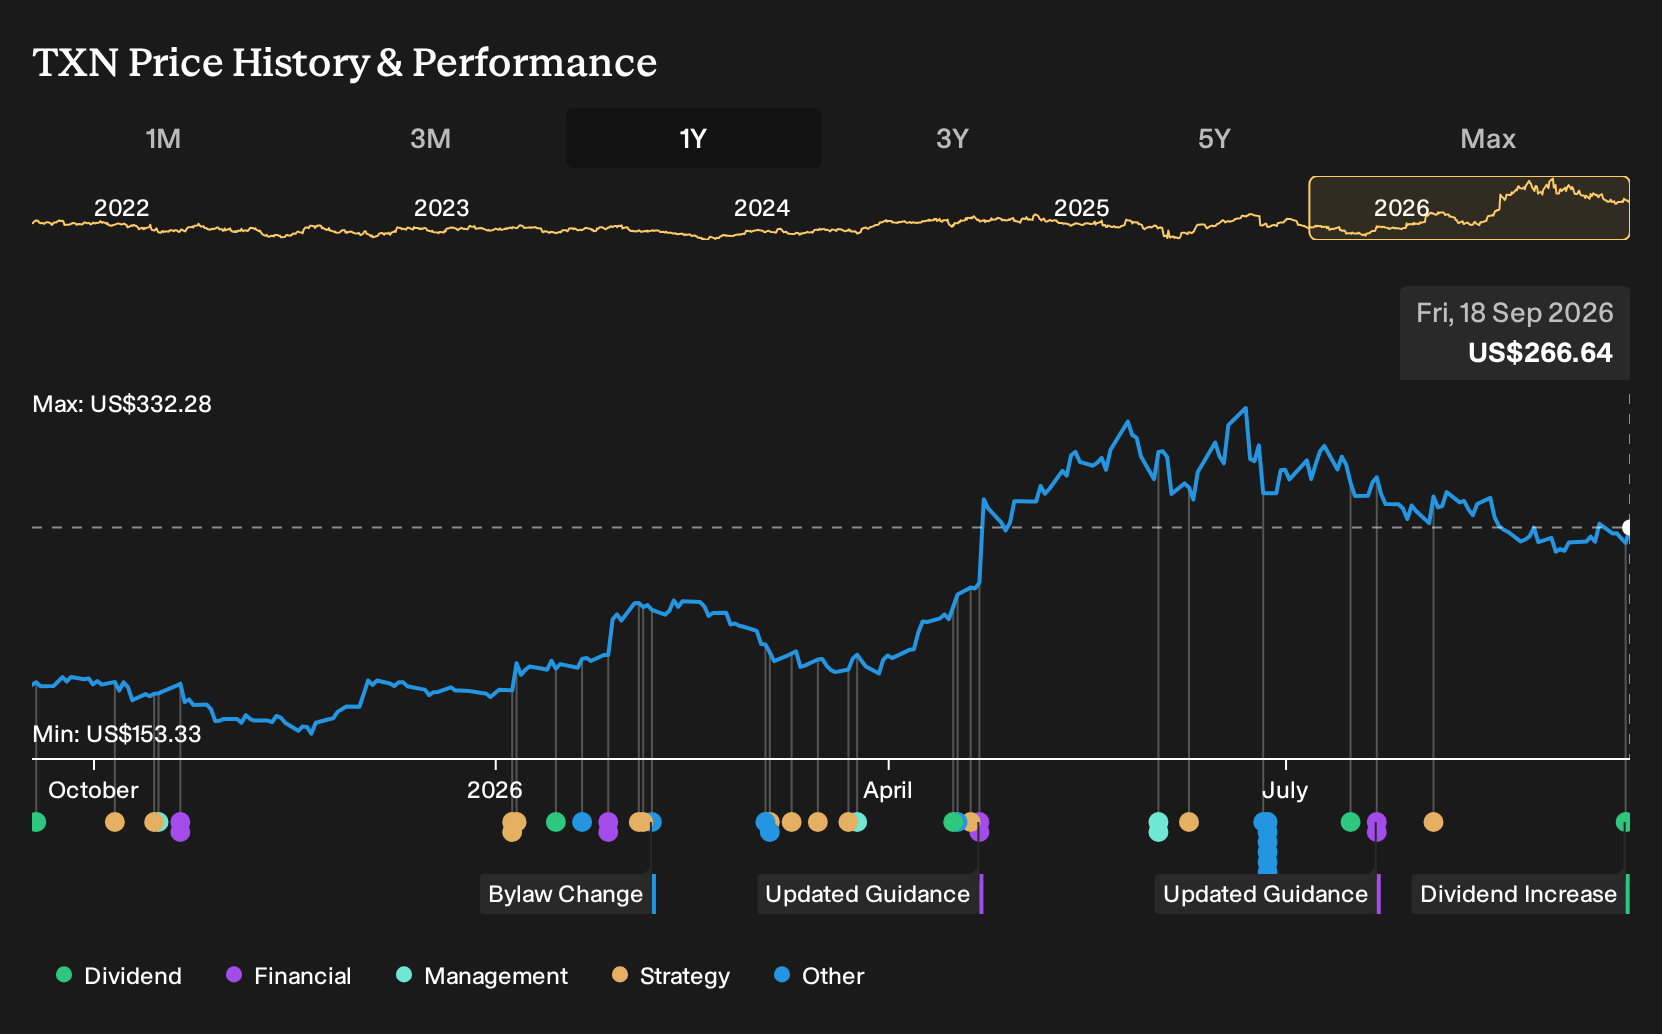
- Texas Instruments announced a 7% increase to its quarterly cash dividend, from $1.42 to $1.52 per share, or $6.08 annualized, payable on November 10, 2026 to holders of record on October 30, 2026, subject to formal board approval.
- The higher payout, which extends Texas Instruments' streak to 23 consecutive years of dividend raises, reflects management's stated aim to return all free cash flow to shareholders over time while continuing its capacity expansion program.
- This article will examine how Texas Instruments' 7% dividend increase could reshape its investment narrative built around cash returns and manufacturing scale.
Texas Instruments Investment Narrative Recap
To own Texas Instruments, you need to believe its focus on industrial and automotive semiconductors, long product cycles, and in-house fabs can support steady demand and healthy profitability over time. The key near-term swing factor is how quickly orders recover in those end markets as investors watch upcoming earnings and management’s comments on utilization.
The 7% dividend hike signals confidence but does not change the main risk. Heavy spending on 300mm fabs and capacity could bite if demand underwhelms, leading to underused factories and pressure on free cash flow. Competitive pressure in analog and embedded chips remains another real watchpoint.
The fresh dividend announcement is a clear recent signal of how Texas Instruments wants to balance its buildout of manufacturing with returns to shareholders. Management describes a goal of returning all free cash flow over time, even while capacity expansion temporarily suppresses that cash generation.
For investors, the tension between a growing dividend and constrained free cash flow is central. If factory projects and the acquisition of Silicon Laboratories execute well, the larger footprint could support the payout. If demand softens or pricing erodes in core segments, the dividend could start to feel less comfortable against cash needs.
Texas Instruments' current analyst storyline points to US$28.8b in revenue and US$11.3b in earnings by 2029. That path assumes revenue growth of 14.0% per year and an earnings increase of about US$5.3b from US$6.0b today.
Uncover why Texas Instruments' fair value indicates a 22% potential upside to its current price, which could narrow quickly.
Exploring Other Perspectives
Some of the most optimistic analysts frame the Texas Instruments dividend hike as just one piece of a much bigger earnings story. They were already penciling in about US$30.8b of revenue and US$12.6b of earnings by 2029. You can treat this 7% raise as a new data point that might push those upbeat narratives even further, or prompt you to compare them with more cautious views before deciding which camp you find more convincing.
Explore 5 other Texas Instruments fair value estimates, including one that suggests there could be up to 63% upside from the current price!
Reach Your Own Conclusion
Disagree with existing narratives? Extraordinary investment outcomes rarely come from following the herd, so rely on your own analysis.
- A great starting point for your Texas Instruments research is our analysis highlighting 3 key rewards and 2 important warning signs that could impact your investment decision.
- See our latest analysis for Texas Instruments. The report includes a comprehensive fundamental analysis summarized in a single visual, the Snowflake, making it easy to evaluate Texas Instruments' overall financial health at a glance.
Looking for more Texas Instruments style ideas?
Once you have a view on Texas Instruments, it helps to compare it with other potential opportunities so you can see where the risk, income and valuation trade offs really sit in your portfolio.
- If capital protection is a priority, start by checking companies that screen well on resilience and balance sheet strength through the 30 resilient stocks with low risk scores.
- For investors focused on income, compare Texas Instruments' payout with a curated set of robust dividend payers using the 6 dividend fortresses.
- If the aim is to uncover fresh ideas beyond the usual watchlist, scan a 16 high quality undiscovered gems that might fit your fundamental checklist.
This article by Simply Wall St is general in nature. We provide commentary based on historical data and analyst forecasts only using an unbiased methodology and our articles are not intended to be financial advice. It does not constitute a recommendation to buy or sell any stock, and does not take account of your objectives, or your financial situation. We aim to bring you long-term focused analysis driven by fundamental data. Note that our analysis may not factor in the latest price-sensitive company announcements or qualitative material. Simply Wall St has no position in any stocks mentioned.
Have feedback on this article? Concerned about the content? Get in touch with us directly. Alternatively, email editorial-team@simplywallst.com