
Why MarketAxess Holdings (MKTX) Is Back In Focus
MarketAxess Holdings (MKTX) is back in focus after fresh data on its fixed income trading platform, which highlights slower revenue growth than many financial peers and essentially flat earnings per share despite that expansion.
Recent trading tells a mixed story for MarketAxess Holdings. The 90-day share price return of 35.81% points to building momentum after a year-to-date share price decline of 8.47% and a 5-year total shareholder return that is down 58.86%. This suggests investors are reassessing both growth prospects and risk after the latest revenue and earnings update.
Scan how MarketAxess Holdings compares with other fixed income and financial platforms by reviewing our hand picked list of solid balance sheet and fundamentals (23 results) while momentum and valuation are back in focus.
After a 90 day rally and years of weak total returns, the question around MarketAxess Holdings is simple: Is the recent rebound just catching up to fair value, or is meaningful upside still in front of the stock?
Most Popular Narrative: 3% Overvalued
MarketAxess Holdings last closed at $163.42 against the most followed fair value estimate of $158, which points to a small valuation premium that investors now have to weigh against the quality of the business and the latest trading update.
The Fair Value estimate has fallen from $195.45 to $158.00, bringing it closer to the proposed $167 per share cash offer for MarketAxess Holdings. The Revenue Growth assumption has been reduced from 7.81% to 6.15%, indicating a more cautious outlook on dollar revenue expansion for MarketAxess.
See why 15 investors see MarketAxess Holdings as 3% overvalued.
Result: Fair Value of $158 (OVERVALUED)
Still, the MarketAxess Holdings story can change quickly if competition further compresses trading fees, or if large bond trades keep favoring phone and chat over electronic execution.
Find out about the key risks to this MarketAxess Holdings narrative.
Another View: What The DCF Says About MarketAxess Holdings
The analyst fair value narrative pins MarketAxess Holdings at $158, yet our DCF model points to a future cash flow value of $201.05 at the current $163.42 share price. That signals a gap where market pricing, analyst targets, and cash flow math are not fully aligned. Which lens do you trust most when money is on the line?
Look into how the SWS DCF model arrives at its fair value.
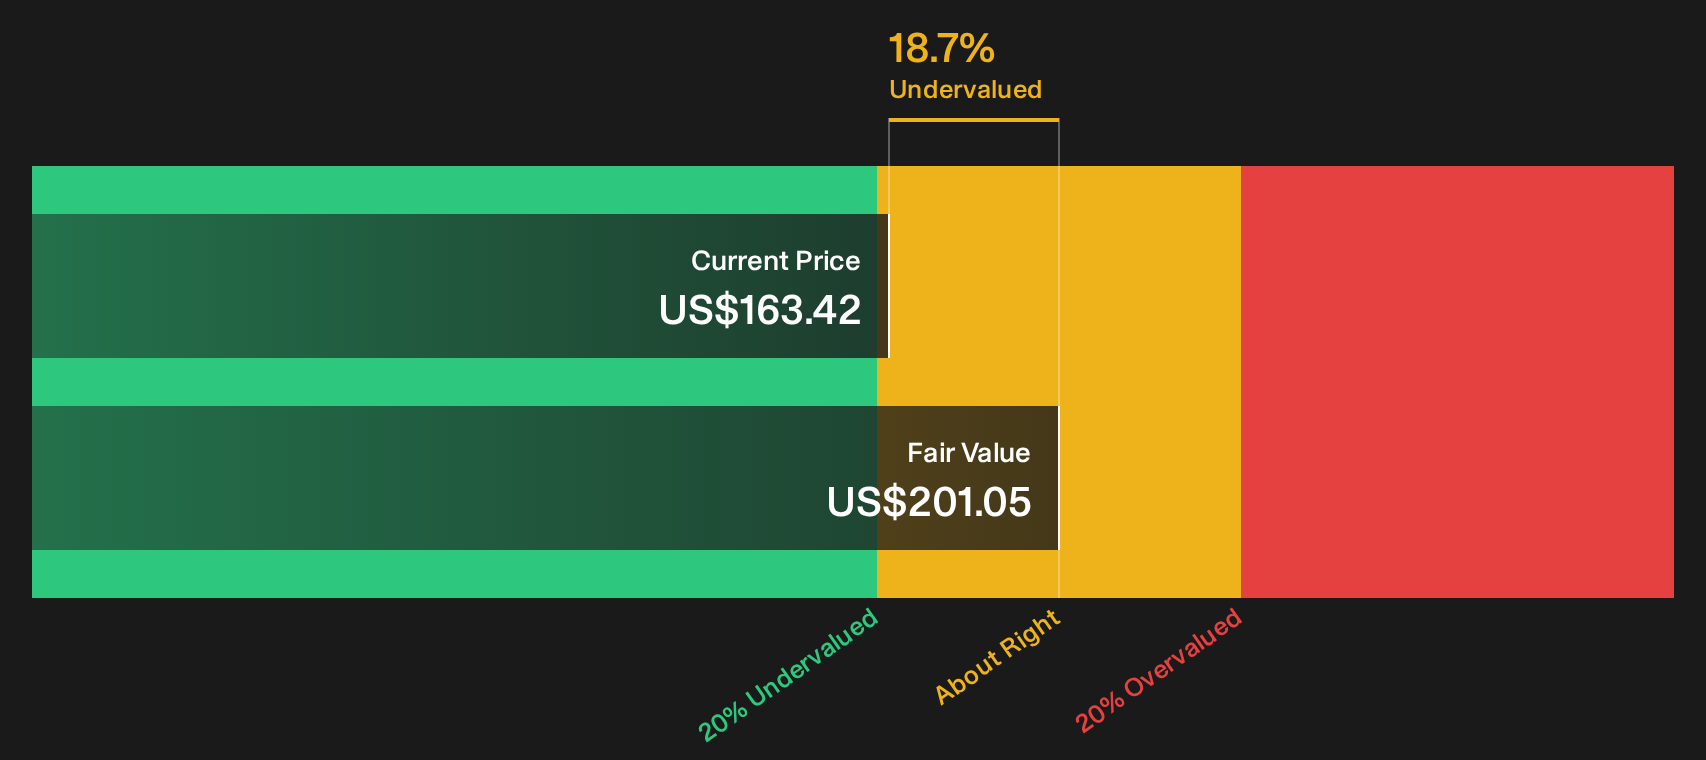
Simply Wall St performs a discounted cash flow (DCF) on every stock in the world every day (check out MarketAxess Holdings for example). We show the entire calculation in full. You can track the result in your watchlist or portfolio and be alerted when this changes, or use our stock screener to discover 33 high quality undervalued stocks. If you save a screener we even alert you when new companies match - so you never miss a potential opportunity.
Next Steps
Sentiment on MarketAxess Holdings is split, with both concern and optimism on display. Move quickly, scrutinize the assumptions, and weigh the 4 key rewards and 1 important warning sign.
Looking for more MarketAxess Holdings investment ideas?
If MarketAxess Holdings has caught your attention, do not stop there. Broaden your watchlist now or risk missing other compelling setups emerging from the data.
- Target quality at a discount by scanning a curated 33 high quality undervalued stocks that combines strong balance sheets with pricing that still looks restrained by key fundamentals.
- Lock in potential income streams by reviewing a focused 6 dividend fortresses that highlights payouts supported by underlying financial strength rather than just eye catching yields.
- Prioritize capital preservation by filtering a 30 resilient stocks with low risk scores that screens for resilient businesses with fewer red flags across core risk metrics.
This article by Simply Wall St is general in nature. We provide commentary based on historical data and analyst forecasts only using an unbiased methodology and our articles are not intended to be financial advice. It does not constitute a recommendation to buy or sell any stock, and does not take account of your objectives, or your financial situation. We aim to bring you long-term focused analysis driven by fundamental data. Note that our analysis may not factor in the latest price-sensitive company announcements or qualitative material. Simply Wall St has no position in any stocks mentioned.
Have feedback on this article? Concerned about the content? Get in touch with us directly. Alternatively, email editorial-team@simplywallst.com