
Redwire (RDW) Could Be 16% Undervalued After Q2 Beat And Higher Outlook
Redwire (RDW) just delivered a strong jolt of information for investors, with Q2 revenue and EBITDA beating expectations and management lifting full year guidance as analysts reassessed the stock’s cash flow potential.
That upbeat Q2 message is landing against a mixed tape for Redwire, with the share price down 7.01% over the last day and 25.16% lower across 90 days, yet still showing an 18.94% year to date share price gain and a 35.09% 1 year total shareholder return that may indicate momentum building over a longer window.
Scan how Redwire compares on cash flows and balance sheet strength by lining it up against the hand picked 33 high quality undervalued stocks that currently screen as potential value opportunities.
Redwire’s mixed share price over the past quarter sits alongside stronger recent execution, which raises a simple tension. Are you seeing a reset in sentiment around space hardware risk, or a market that is still underpricing the underlying cash generation story ahead?
Most Popular Narrative: 16% Undervalued
Redwire’s most followed narrative points to a fair value of $12.82 against a last close of $10.74, which puts the current Q2 beat and guidance raise into a broader story about cash flows catching up to the share price.
The pipeline of roughly US$10 billion of identified opportunities, with US$3 billion of proposals submitted year to date and a Q3 2025 book to bill ratio of 1.25x that lifted backlog to US$355.6 million, suggests that converting even a portion of this funnel could support revenue visibility and a path toward positive adjusted EBITDA and cash from operations.
See why 35 investors see Redwire as 16% undervalued.
According to Bailey, the narrative leans heavily on that opportunity funnel and backlog build, using a 7.80% discount rate to infer what those contracts could mean when translated into cash generation over time. It treats Redwire as a space and defense platform that spans sensors, uncrewed aircraft systems, space infrastructure and microgravity research, then values that mix at $12.82 per share against today’s $10.74 trading level.
The story also folds in Redwire’s current profile, where revenue of $426.27m sits beside a reported net loss of $258.71m and a value score of 2. It argues that the equity market may be focusing more on recent dilution and ongoing losses than on the longer term conversion of its roughly $10b pipeline. That is why the narrative result lands at a 16.2% discount to fair value rather than calling the stock expensive despite P/S based checks flagging it as rich versus peers.
Result: Fair Value of $12.82 (UNDERVALUED)
Still, Redwire’s reliance on U.S. government programs and ongoing adjusted EBITDA losses, along with potential dilution from the US$250m equity program, could quickly challenge this upside narrative.
Find out about the key risks to this Redwire narrative.
Another View on Redwire’s Valuation
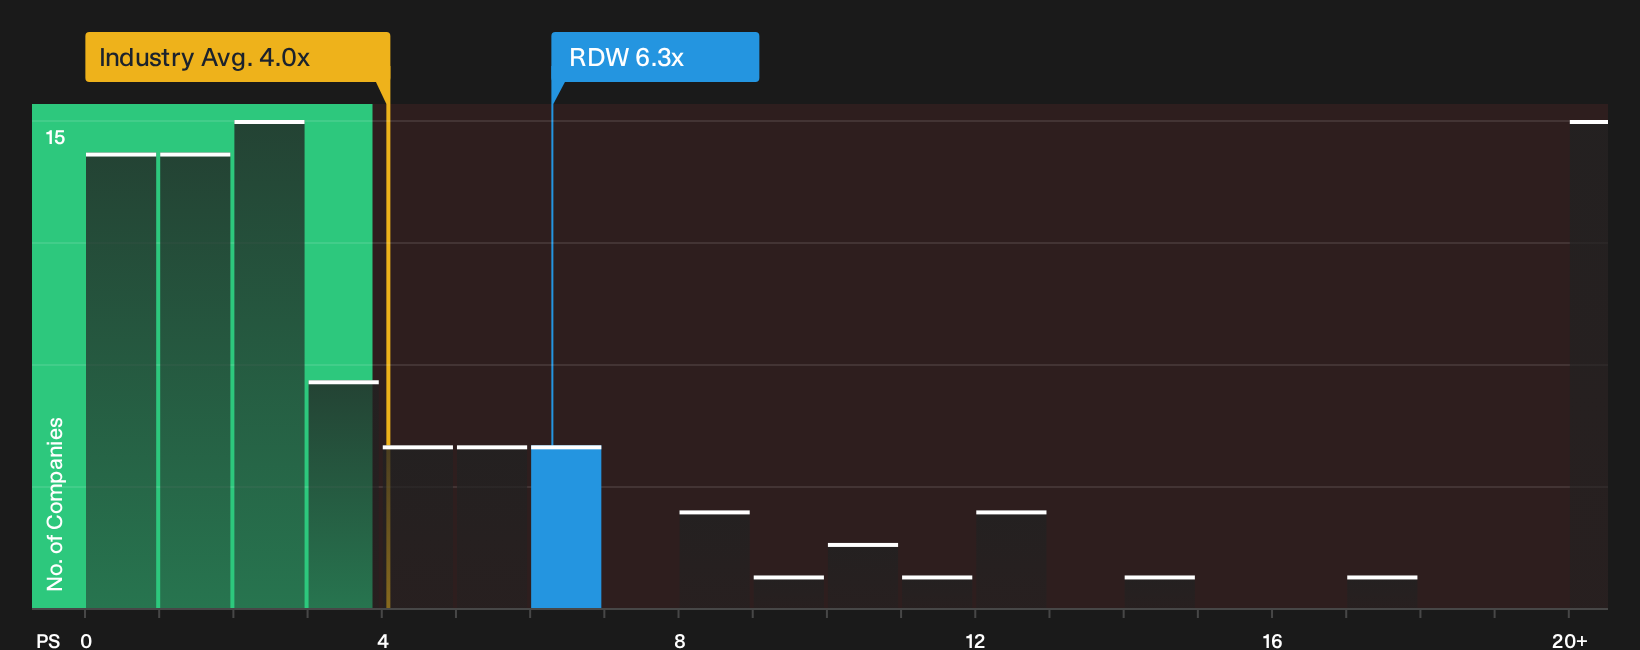
There is a different read on Redwire when you look at what investors are paying for each dollar of sales. The stock trades on a P/S of 6.3x, compared with 4.0x for the US Aerospace & Defense group and a fair ratio of 2.9x that the market could move toward over time.
That makes the shares look expensive on this yardstick, which raises a practical question for you. Is the gap a sign of overpaying for future potential, or a risk you are comfortable holding while the story plays out?
See what the numbers say about this price — find out in our valuation breakdown.
Next Steps
Mixed signals or early inflection for Redwire. Consider reviewing the key data points yourself and weigh both the upside drivers and the caution flags captured in the 2 key rewards and 3 important warning signs.
Looking for more Redwire investment ideas?
If you stop with Redwire, you miss the chance to spot other opportunities that fit your style. Use the Simply Wall Street Screener to pressure test your next move.
- Target potential bargains by zeroing in on companies that match your quality and valuation filters through the 33 high quality undervalued stocks.
- Protect your capital by focusing on businesses with healthier finances using the list of solid balance sheet and fundamentals (23 results).
- Hunt for underfollowed opportunities by scanning the 16 high quality undiscovered gems before the crowd catches on.
This article by Simply Wall St is general in nature. We provide commentary based on historical data and analyst forecasts only using an unbiased methodology and our articles are not intended to be financial advice. It does not constitute a recommendation to buy or sell any stock, and does not take account of your objectives, or your financial situation. We aim to bring you long-term focused analysis driven by fundamental data. Note that our analysis may not factor in the latest price-sensitive company announcements or qualitative material. Simply Wall St has no position in any stocks mentioned.
Have feedback on this article? Concerned about the content? Get in touch with us directly. Alternatively, email editorial-team@simplywallst.com