
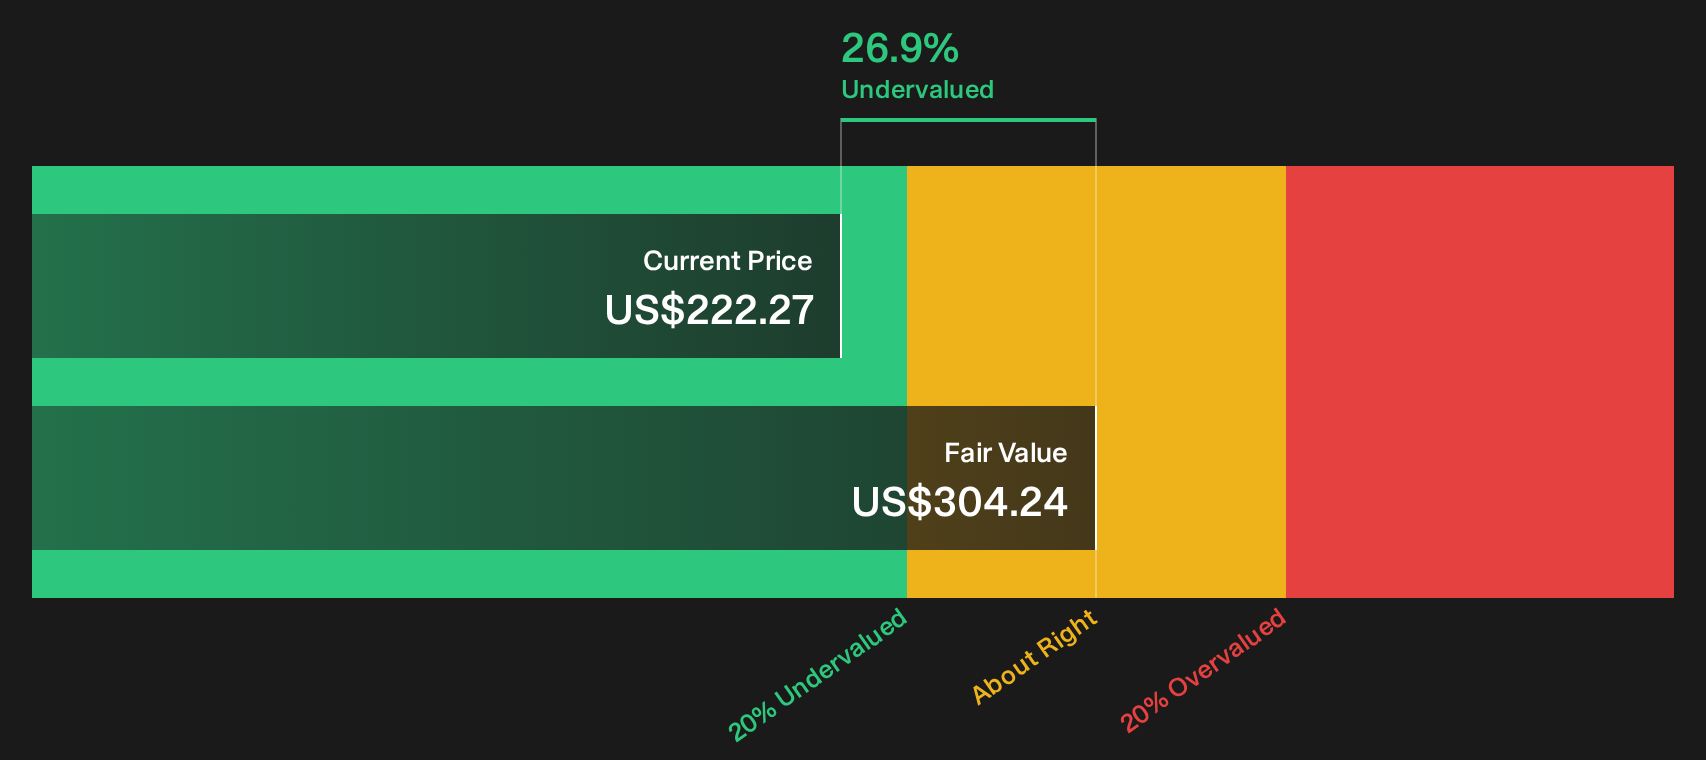
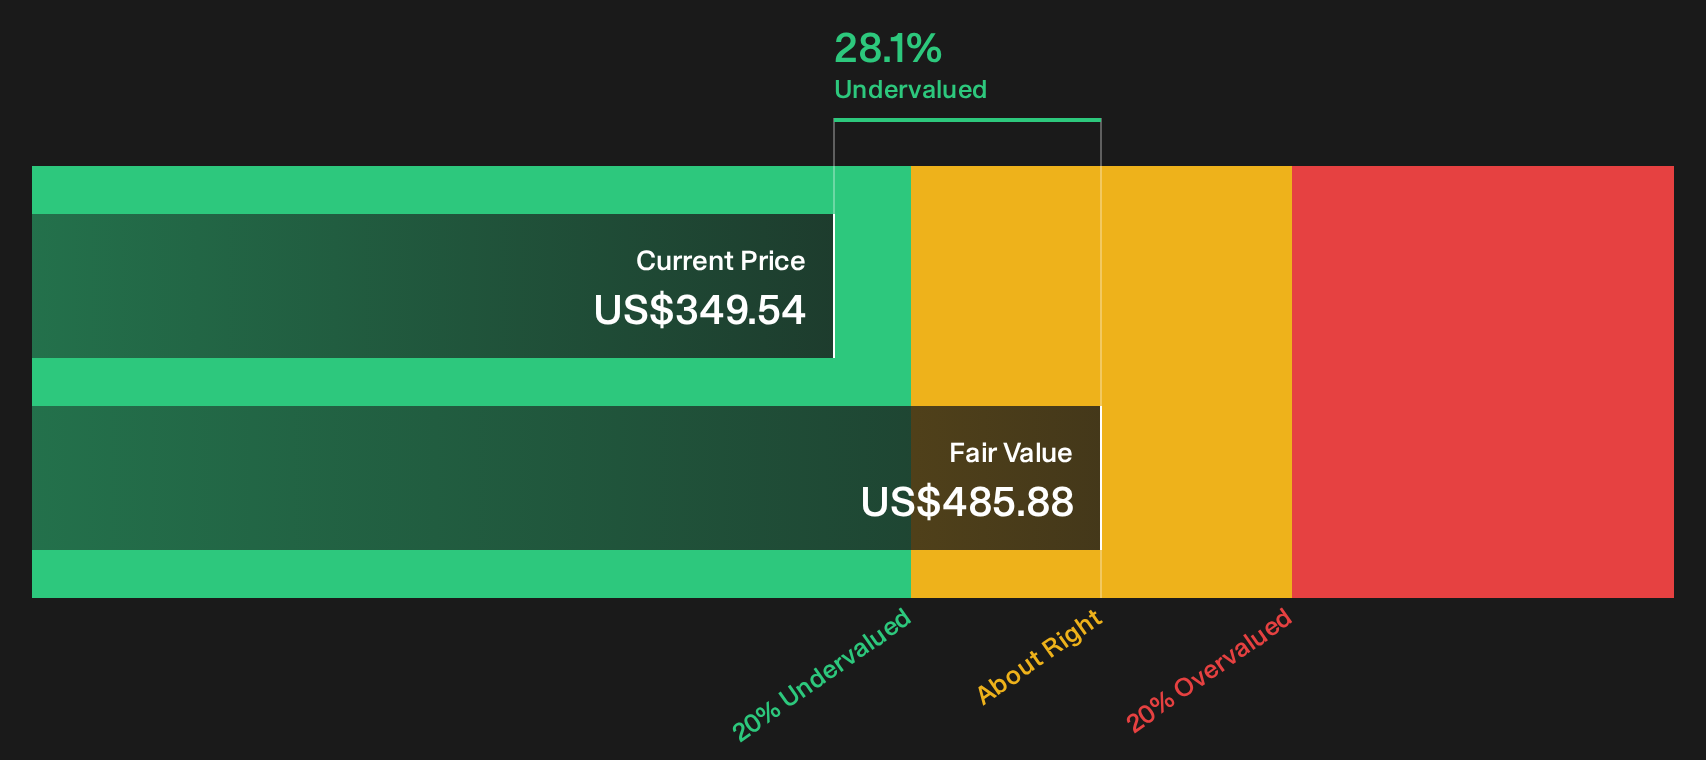
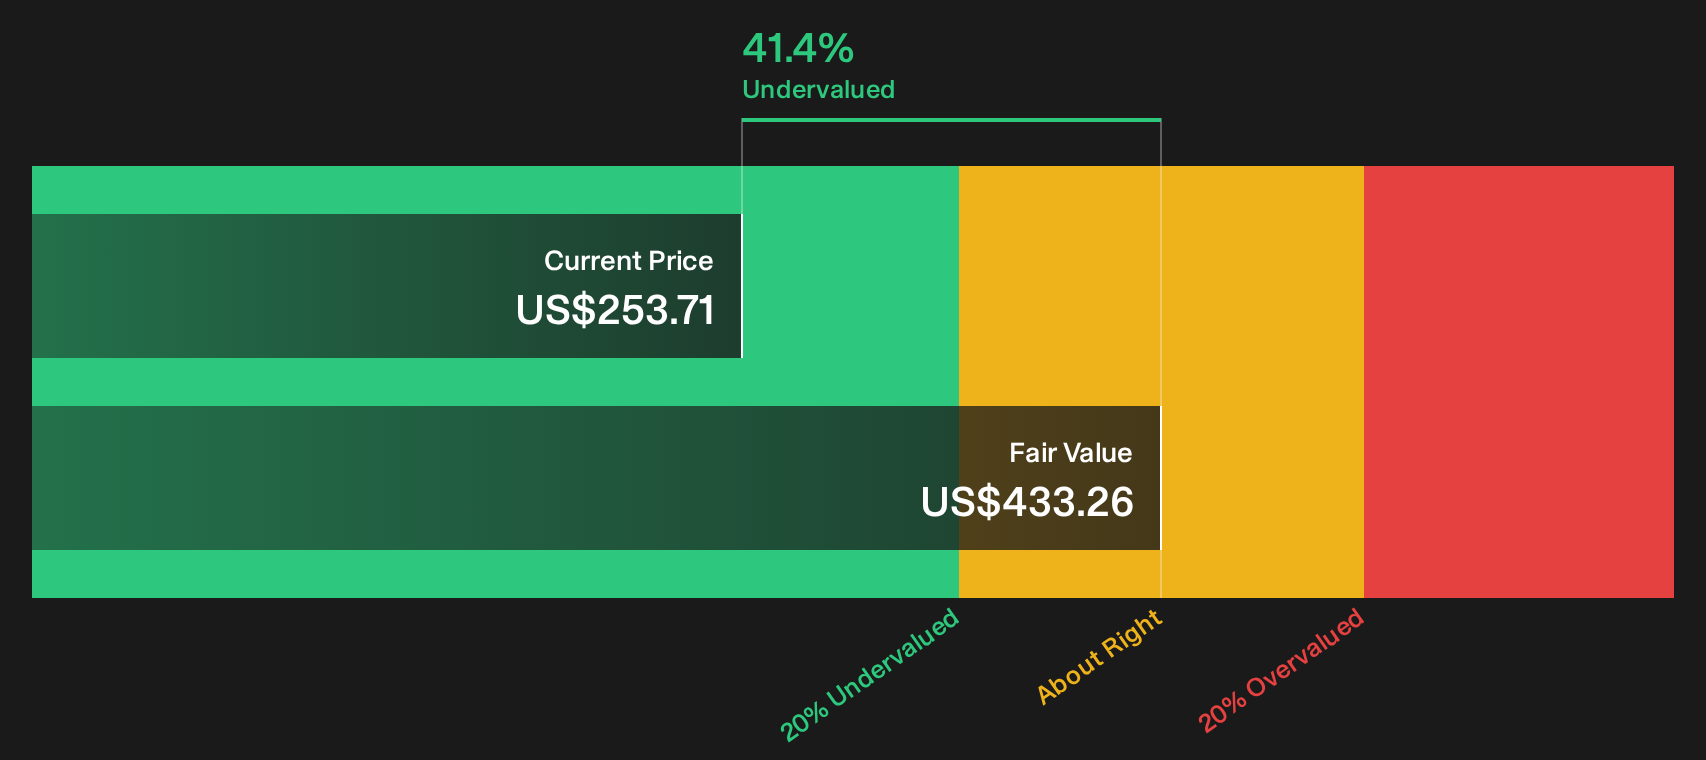
3 Cash Flow Stocks Trading At Least 27% Below Fair Value
Fresh US legislation that allows tariffs of up to 100% on countries buying Russian oil has pushed trade risks and funding costs back into focus. That kind of shock can turn reliable cash flow generators into temporarily unloved stocks. For patient investors, mispriced cash streams can be attractive. This article highlights three companies that our cash flow screen flags as undervalued on a discounted basis.
The three stocks below are just a starter set. The full cash flow screen surfaced 195 more companies with equally compelling narratives that are not covered here. To identify and analyze those potential opportunities in detail, head straight into the Undervalued Stocks Based On Cash Flows screener.
NVIDIA (NVDA)
Overview: NVIDIA builds data center scale AI computing and networking platforms, plus GPUs and software used across gaming, visualization, cloud and automotive markets.
Operations: NVIDIA generates about US$275.4b from Compute & Networking and US$27.6b from Graphics, with revenue mainly from the United States and Taiwan.
Market Cap: US$5,362.1b
NVIDIA matters for this cash flow focused screen because its AI data center hardware and software turn heavy infrastructure spending into recurring, high margin cash generation.
"Uptake of an open-source, cheaper or better platform than Nvidia's CUDA would heavily undermine Nvidia's moat and enable any sizeable firm to directly engage semiconductor manufacturers, such as TSMC, to produce their own chips, stealing away Nvidia's high margin products."
For investors, the key question is what happens if a single deeply embedded assumption about future pricing power in this AI infrastructure cycle quietly shifts.
That pricing shift risk is exactly why it helps to read the full narrative for NVIDIA, which explains how Nvidia's cash engine could either accelerate or stall next.
Alphabet (GOOGL)
Overview: Alphabet runs Google Search, YouTube, Android and other services, while Google Cloud and Vertex AI sell enterprise AI infrastructure and tools.
Operations: Alphabet generates about US$367.1b from Google Services, US$77.6b from Google Cloud and US$1.5b from Other Bets, mostly in the United States.
Market Cap: US$4,227.7b
Alphabet matters for this undervalued cash flow screen because Google Cloud’s AI infrastructure and Vertex AI turn large enterprise AI workloads directly into metered, recurring cash generation tied to long-term compute commitments.
"Google Cloud has gone from “meh” to money-maker. • Now #3 globally behind AWS and Azure, with over 11% market share."
What really tests that cash engine over time is how one huge, still unresolved cost and capacity constraint shapes future free cash flow.
That cost pressure is exactly why the full narrative for Alphabet unpacks whether Alphabet’s AI infrastructure cash machine is quietly accelerating or if rising capacity demands are already masking key risks.
Amazon.com (AMZN)
Overview: Amazon.com runs global online and physical retail platforms, advertising and subscription services, with Amazon Web Services supplying cloud and AI infrastructure.
Operations: Amazon.com generates about US$453.7b from North America, US$173.6b from International operations and US$148.4b from Amazon Web Services.
Market Cap: US$2,709.4b
Amazon.com matters for this cash flow focused screen because AWS turns cloud compute, storage and AI workloads into recurring, high margin cash generation that underpins discounted cash flow value.
"AWS reaccelerated through 2025 with roughly 20% year-over-year growth, exiting the year with an annualized revenue base exceeding $130 billion."
What really moves the needle for investors is how one looming decision on AI infrastructure spend shapes the eventual margin profile and free cash flow.
That margin question is exactly where the full narrative for Amazon.com shows whether Amazon.com’s AI infrastructure spending is quietly accelerating durable cash flow or masking emerging pressure points.
Seeking Fresh Alternatives Before They Fly
Fresh cash flow stories keep breaking out while older ideas lose momentum and get caught by the crowd. Scan under the radar for now and act while opportunities remain less widely followed.
- Spot income workhorses built to keep paying by scanning a curated pool of 6 dividend fortresses before yields drop and investors chase them higher.
- Track early movers riding AI infrastructure momentum with a focused set of 89 AI infrastructure stocks while they are still flying under broader market radars.
- Target operators built to weather shocks by reviewing a tight 30 resilient stocks with low risk scores that filters for durability before volatility hits with full force.
This article by Simply Wall St is general in nature. We provide commentary based on historical data and analyst forecasts only using an unbiased methodology and our articles are not intended to be financial advice. It does not constitute a recommendation to buy or sell any stock, and does not take account of your objectives, or your financial situation. We aim to bring you long-term focused analysis driven by fundamental data. Note that our analysis may not factor in the latest price-sensitive company announcements or qualitative material. Simply Wall St has no position in any stocks mentioned.
Have feedback on this article? Concerned about the content? Get in touch with us directly. Alternatively, email editorial-team@simplywallst.com