
Why CME Group (CME) Is Back In The Spotlight
CME Group (CME) just switched on S&P UBS USD Liquid Leveraged Loan Index futures, giving traders the first exchange-traded way to hedge a broad leveraged loan benchmark through centrally cleared contracts.
CME Group shares have been moving higher, with a 12.0% 90 day share price return and a 9.6% total shareholder return over the past year. That momentum now sits alongside fresh product launches in credit, metals and a new U.S. Treasury clearing venture.
Scan other exchanges-focused plays that show similar product momentum with our curated list of solid balance sheet and fundamentals (23 results) as a potential starting point alongside CME Group.
CME Group now trades only slightly below the average analyst target despite a recent run. Is that a modest discount to fair value, or a sign that investors still see real risk in the story?
Most Popular Narrative: 2% Undervalued
On Simply Wall St's most followed narrative, CME Group screens as slightly undervalued, with a fair value of $282.36 against the last close at $276.01. That small gap rests on specific expectations about how volume, margins and product mix evolve over the next few years.
The ongoing global shift toward electronic trading, greater regulatory demands for transparency and standardized clearing, and a proven ability to grow non-transactional revenue (e.g., record market data revenue) position CME to capture a larger share of trading activity and support durable long-term earnings growth.
See why 48 investors see CME Group as 2% undervalued.
Result: Fair Value of $282.36 (UNDERVALUED)
Still, the bullish CME Group story can crack if lower futures volatility drags on volumes or if DeFi style venues steadily chip away at fee pools.
Find out about the key risks to this CME Group narrative.
Another Lens on CME Group’s Value
The earlier narrative leans on analyst targets that frame CME Group as modestly undervalued around a fair value of $282.36. A different lens comes from Simply Wall St’s DCF work, which puts future cash flow value closer to $248.89, implying the stock trades above that mark. Which story do you think fits your own assumptions?
Look into how the SWS DCF model arrives at its fair value.
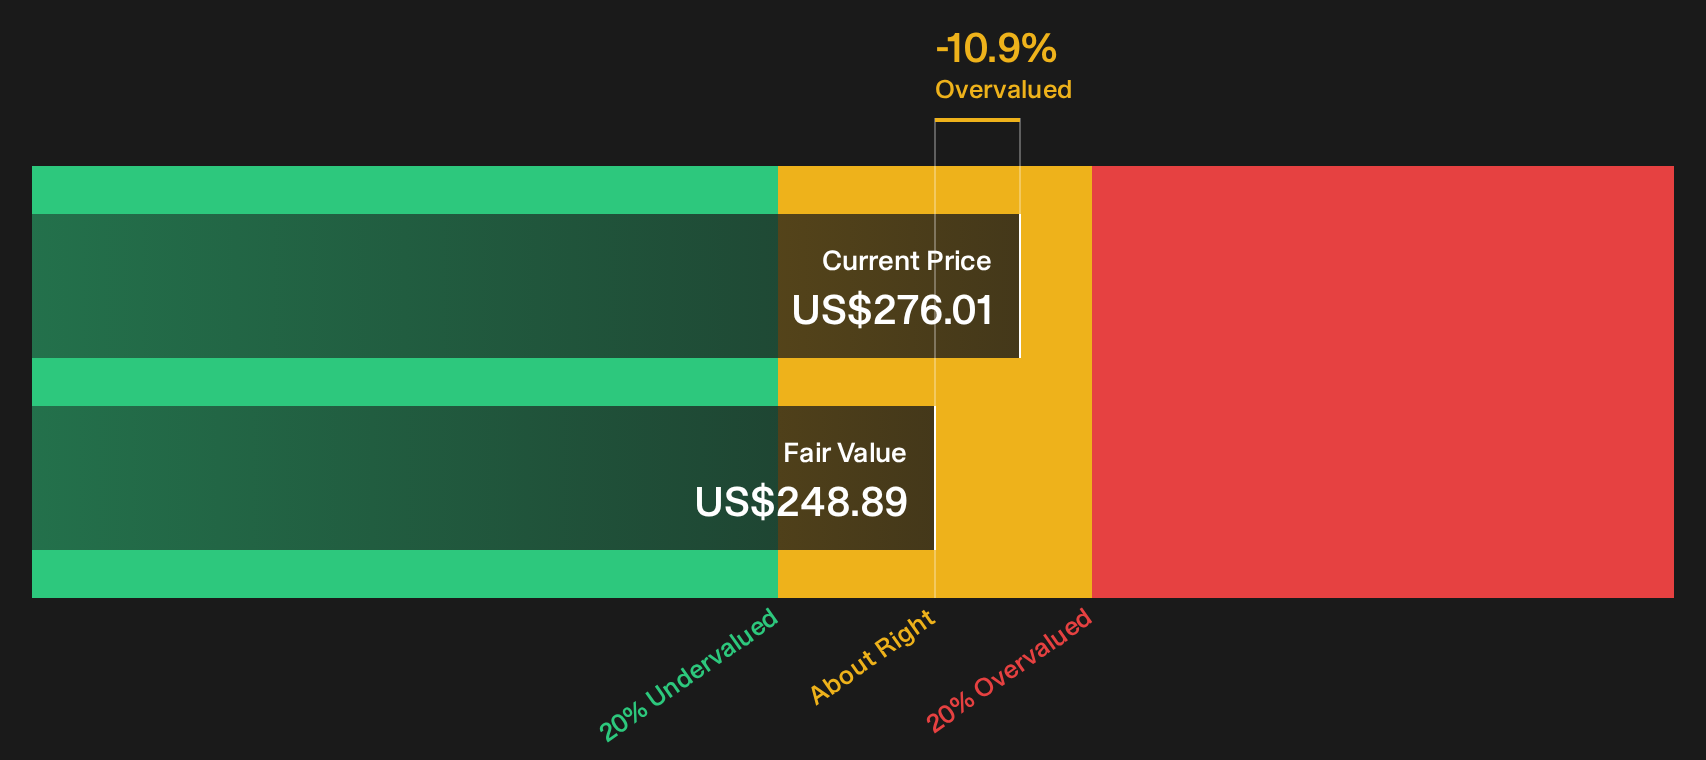
Simply Wall St performs a discounted cash flow (DCF) on every stock in the world every day (check out CME Group for example). We show the entire calculation in full. You can track the result in your watchlist or portfolio and be alerted when this changes, or use our stock screener to discover 33 high quality undervalued stocks. If you save a screener we even alert you when new companies match - so you never miss a potential opportunity.
Next Steps
Mixed signals around CME Group’s valuation are exactly why fresh eyes on the numbers matter, especially when sentiment can shift quickly. Take a few minutes to weigh both the upside and the downside using the 2 key rewards and 2 important warning signs.
Looking for more CME Group sized investment ideas?
If you stop with CME Group, you only see one angle. Broaden your watchlist with more focused ideas that can sharpen how you allocate your next dollar.
- Target steadier potential returns by using the 30 resilient stocks with low risk scores that filters for businesses with more resilient profiles and lower risk scores.
- Hunt for mispriced quality through the 33 high quality undervalued stocks that highlights companies combining stronger fundamentals with what may be more appealing valuations.
- Spot future leaders early by scanning the 16 high quality undiscovered gems which surfaces financially solid companies that many investors have not focused on yet.
This article by Simply Wall St is general in nature. We provide commentary based on historical data and analyst forecasts only using an unbiased methodology and our articles are not intended to be financial advice. It does not constitute a recommendation to buy or sell any stock, and does not take account of your objectives, or your financial situation. We aim to bring you long-term focused analysis driven by fundamental data. Note that our analysis may not factor in the latest price-sensitive company announcements or qualitative material. Simply Wall St has no position in any stocks mentioned.
Have feedback on this article? Concerned about the content? Get in touch with us directly. Alternatively, email editorial-team@simplywallst.com