
Luxempart (BDL:LXMPR) Could Be 6% Undervalued On Strong Half Year Earnings
Half year earnings put Luxempart results in focus
Luxempart (BDL:LXMPR) just reported half year earnings to June 30, 2026, with net income of €82.3 million and basic earnings per share from continuing operations of €4.08.
Luxempart’s latest half year figures land against a share price of €73.5, with a 1 day share price return of 0.68% and a year to date share price gain of 16.67% pointing to healthier momentum after recent 30 and 90 day declines, while a 1 year total shareholder return of 8.89% and 5 year total shareholder return of 1.89% present a more moderate long run picture.
Compare Luxempart’s latest earnings momentum with a hand picked set of financially solid peers using the list of solid balance sheet and fundamentals (197 results) to see how it stacks up on quality and resilience.
Luxempart has delivered stronger earnings while the share price has already moved higher this year. Is most of the easy upside gone, or do the current numbers still leave meaningful room on the table?
Price-to-Earnings of 5.3x for Luxempart: Is it justified?
On a P/E of 5.3x against the latest close at €73.5, Luxempart screens as inexpensive relative to both peers and the wider European capital markets group.
The P/E ratio compares today’s share price with earnings per share. For an investment firm like Luxempart, it gives a quick read on how much investors are paying for each euro of profit that the portfolio generates.
With earnings growing very strongly over the past year and current net profit margins at 93.8%, a 5.3x multiple suggests the market is pricing those profits cautiously rather than generously. That gap between robust recent profitability and a low earnings multiple points to investors applying a discount to the sustainability or repeatability of current results, rather than paying up for them.
The discount is clear when stacked against reference points. Luxempart trades on a P/E of 5.3x compared with the European capital markets industry at 13.3x and a hand picked peer group at 9.5x, a steep markdown that signals the market is valuing its earnings at far lower levels than comparable stocks.
See what the numbers say about this price — find out in our valuation breakdown.
Result: Price-to-Earnings of 5.3x (UNDERVALUED)
Still, Luxempart’s concentrated exposure to European private investments and its very high recent net margin could quickly look fragile if deal values or exits soften.
Find out about the key risks to this Luxempart narrative.
Another View on Luxempart’s value
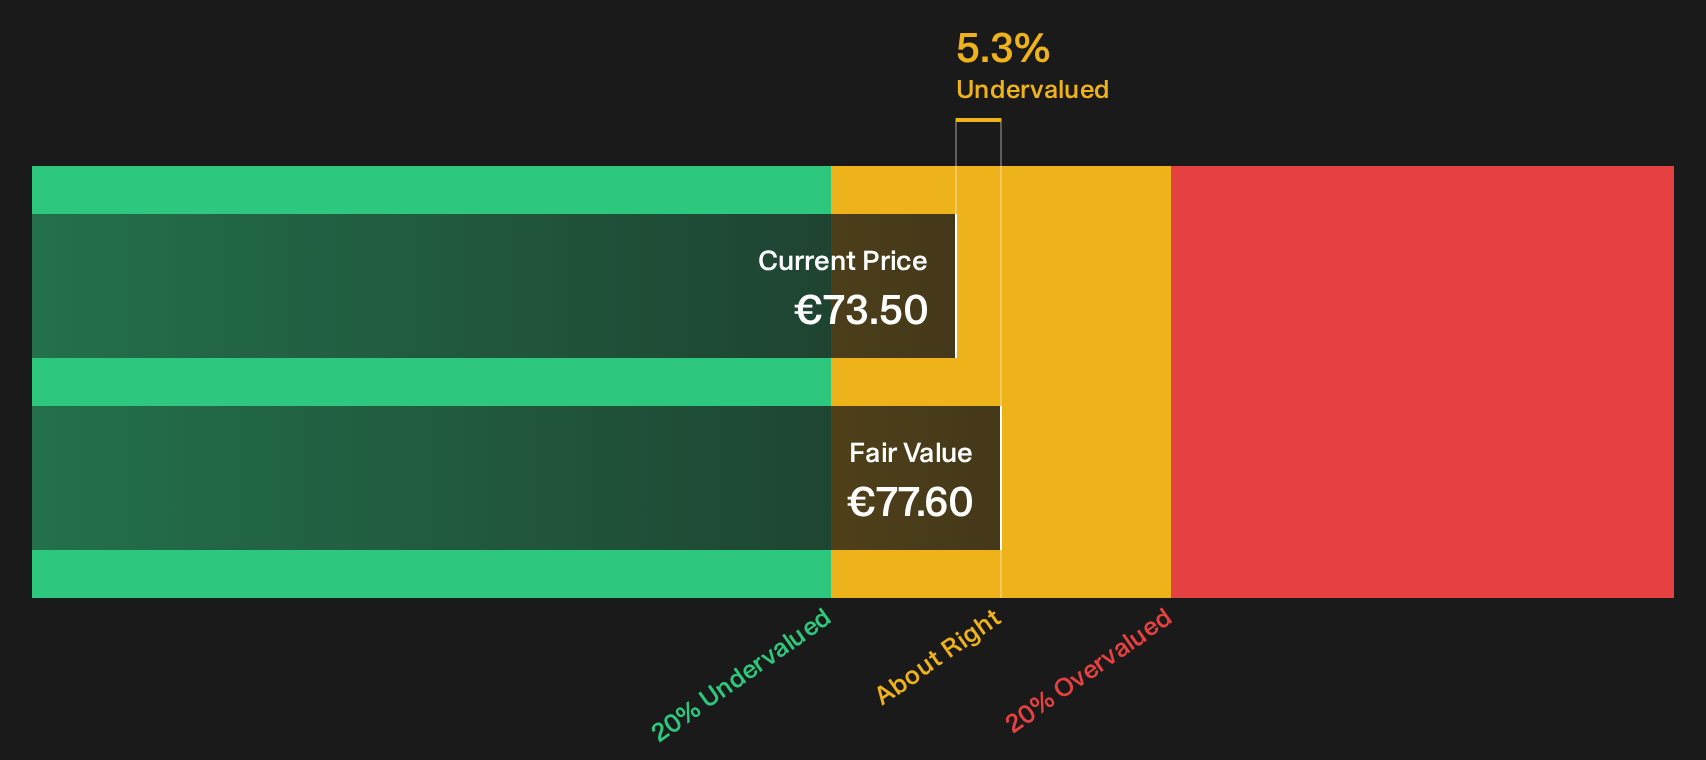
There is a different angle once the SWS DCF model is brought in. At €73.5, Luxempart is trading below an estimated future cash flow value of €77.6, which implies a modest undervaluation rather than a deep discount.
That smaller gap can matter. It suggests less room for error if portfolio earnings or exit conditions weaken again. It also raises the question of whether the low P/E reflects caution that the cash flow model does not fully capture.
Look into how the SWS DCF model arrives at its fair value.
Simply Wall St performs a discounted cash flow (DCF) on every stock in the world every day (check out Luxempart for example). We show the entire calculation in full. You can track the result in your watchlist or portfolio and be alerted when this changes, or use our stock screener to discover 179 high quality undervalued stocks. If you save a screener we even alert you when new companies match - so you never miss a potential opportunity.
Next Steps
Mixed signals from Luxempart so far? Treat this as a prompt to move quickly, review the underlying data in detail, and stress test your own thesis against the 2 key rewards and 2 important warning signs.
Looking for more investment ideas beyond Luxempart?
If Luxempart’s setup has sharpened your focus, do not stop here. Fresh ideas often come from comparing new opportunities side by side.
- Target potential bargains with solid fundamentals by scanning for companies that look mispriced on quality and valuation using the 179 high quality undervalued stocks.
- Prioritise resilience and sleep better at night by checking a curated 227 resilient stocks with low risk scores that screens for companies with lower overall risk scores and sturdier profiles.
- Hunt for future leaders that are not yet crowded by institutions through the 612 high quality undiscovered gems, where strong fundamentals meet lighter market attention.
This article by Simply Wall St is general in nature. We provide commentary based on historical data and analyst forecasts only using an unbiased methodology and our articles are not intended to be financial advice. It does not constitute a recommendation to buy or sell any stock, and does not take account of your objectives, or your financial situation. We aim to bring you long-term focused analysis driven by fundamental data. Note that our analysis may not factor in the latest price-sensitive company announcements or qualitative material. Simply Wall St has no position in any stocks mentioned.
Have feedback on this article? Concerned about the content? Get in touch with us directly. Alternatively, email editorial-team@simplywallst.com