
Redcare Pharmacy (XTRA:RDC) Shares Climbed, What Is Behind The Fresh Attention?
PoPP draft sharpens Redcare Pharmacy’s digital prescription roadmap
Redcare Pharmacy (XTRA:RDC) is back in focus after Germany’s digital health agency gematik released a new draft for Proof of Patient Presence, laying technical groundwork for Health ID based remote authentication.
Investors have welcomed the PoPP progress in the very short term, with Redcare Pharmacy’s 1-day share price return of 3.55% and 7-day gain of 2.47% offering a brief rebound. However, the 30-day share price return is down 16.34% and the 1-year total shareholder return has declined 28.43%, pointing to pressure that has built over several years rather than a sudden shift in sentiment.
Scan other digital health and e-prescription players with stronger price action and clearer planning visibility using a curated list of list of solid balance sheet and fundamentals (194 results) as potential comparables to Redcare Pharmacy.
The PoPP news has given Redcare Pharmacy a small bounce after a long slide. Is this a sign that the business narrative is catching up, or just sentiment whipsawing before valuation does the talking?
Preferred price-to-sales of 0.3x for Redcare Pharmacy: Is it justified?
Valuation on Redcare Pharmacy is pulling in two directions. On one hand, the shares trade on a P/S ratio of 0.3x, which looks cheaper than the wider European consumer retailing group at 0.4x. On the other hand, that same 0.3x sits above both peer averages and an internally estimated fair level, suggesting the current tag is not straightforwardly low.
The P/S multiple compares the market value of the equity to yearly revenue. It is often used for businesses like Redcare Pharmacy that are still loss making, because earnings do not yet give a clean signal. A lower P/S usually means investors are paying less for each euro of sales, which can either point to a bargain or to concerns around margins, competition or execution.
Here the picture is mixed. Relative to the broader European consumer retailing industry, Redcare Pharmacy changes hands at a lower P/S, so the market is valuing each euro of its €3,217.4m in revenue below the sector average. Yet against a closer peer set, the same 0.3x is described as expensive compared with a 0.2x average, and also sits above an estimated fair P/S of 0.2x that the market could move towards if sentiment and expectations reset.
Explore the SWS fair ratio for Redcare Pharmacy.
Result: Price-to-sales of 0.3x (OVERVALUED).
Still, the long share price slide and ongoing net loss of €42.0m keep the risk that sentiment turns again if execution on e-prescriptions disappoints.
Find out about the key risks to this Redcare Pharmacy narrative.
Another view on Redcare Pharmacy’s value
The P/S discussion presents Redcare Pharmacy as slightly expensive, yet the SWS DCF model points in the opposite direction. At €54, the shares trade significantly below an estimated future cash flow value of €338.42, which indicates a substantial gap between current pricing and that long term cash flow assessment.
Look into how the SWS DCF model arrives at its fair value.
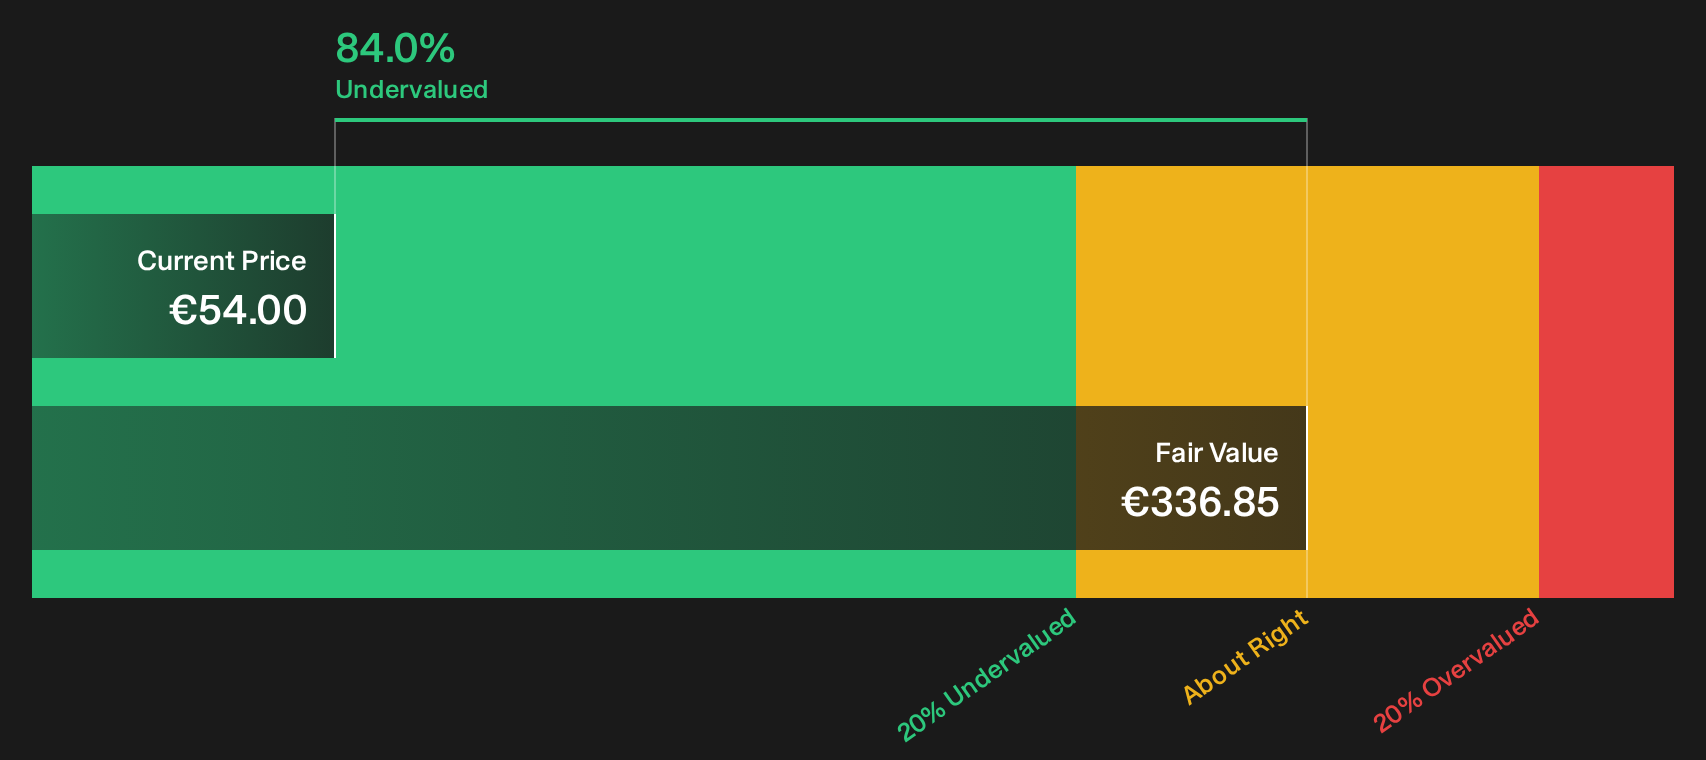
Simply Wall St performs a discounted cash flow (DCF) on every stock in the world every day (check out Redcare Pharmacy for example). We show the entire calculation in full. You can track the result in your watchlist or portfolio and be alerted when this changes, or use our stock screener to discover 189 high quality undervalued stocks. If you save a screener we even alert you when new companies match - so you never miss a potential opportunity.
Next Steps
Mixed signals around Redcare Pharmacy can feel confusing, so consider acting promptly, review the underlying data for yourself, and weigh both the upside and the warning flags by reviewing the 2 key rewards and 2 important warning signs.
Looking for more Redcare Pharmacy style investment ideas?
Do not stop at Redcare Pharmacy. Broaden your watchlist with focused screeners that surface different types of opportunities so you are not relying on a single story.
- Target potential bargains early and sift through companies trading on compelling fundamentals using the 189 high quality undervalued stocks.
- Secure your income stream by reviewing businesses that pair higher yields with resilience through the 161 dividend fortresses.
- Prioritize capital protection and scan for companies with steadier profiles and fewer red flags via the 104 resilient stocks with low risk scores.
This article by Simply Wall St is general in nature. We provide commentary based on historical data and analyst forecasts only using an unbiased methodology and our articles are not intended to be financial advice. It does not constitute a recommendation to buy or sell any stock, and does not take account of your objectives, or your financial situation. We aim to bring you long-term focused analysis driven by fundamental data. Note that our analysis may not factor in the latest price-sensitive company announcements or qualitative material. Simply Wall St has no position in any stocks mentioned.
Have feedback on this article? Concerned about the content? Get in touch with us directly. Alternatively, email editorial-team@simplywallst.com