
Asian Market Insights 3 Stocks That May Be Trading Below Estimated Value
Amidst a backdrop of geopolitical tensions and fluctuating oil prices, Asian markets have been navigating a complex economic landscape. As investors seek opportunities in this environment, identifying stocks that may be trading below their estimated value becomes crucial for potential long-term gains.
Top 10 Undervalued Stocks Based On Cash Flows In Asia
| Name | Current Price | Fair Value (Est) | Discount (Est) |
| Shizuki Electric (TSE:6994) | ¥1175.00 | ¥2305.87 | 49% |
| Rakus (TSE:3923) | ¥1061.00 | ¥2075.67 | 48.9% |
| P.S.P. Specialties (SET:PSP) | THB7.70 | THB14.85 | 48.1% |
| PAL GROUP Holdings (TSE:2726) | ¥1479.00 | ¥2874.94 | 48.6% |
| Ichikoh Industries (TSE:7244) | ¥555.00 | ¥1073.40 | 48.3% |
| Dongwon Industries (KOSE:A006040) | ₩36200.00 | ₩70708.77 | 48.8% |
| Cosmo Energy Holdings (TSE:5021) | ¥4638.00 | ¥9270.04 | 50% |
| Cheil Worldwide (KOSE:A030000) | ₩17550.00 | ₩33983.59 | 48.4% |
| BuySell TechnologiesLtd (TSE:7685) | ¥2850.00 | ¥5580.47 | 48.9% |
| AK Medical Holdings (SEHK:1789) | HK$4.855 | HK$9.60 | 49.4% |
Here we highlight a subset of our preferred stocks from the screener.
SRA Holdings (TSE:3817)
Overview: SRA Holdings, Inc. offers software development and maintenance services both in Japan and internationally, with a market cap of ¥60.33 billion.
Operations: SRA Holdings generates revenue primarily from its software development and maintenance services offered both domestically in Japan and internationally.
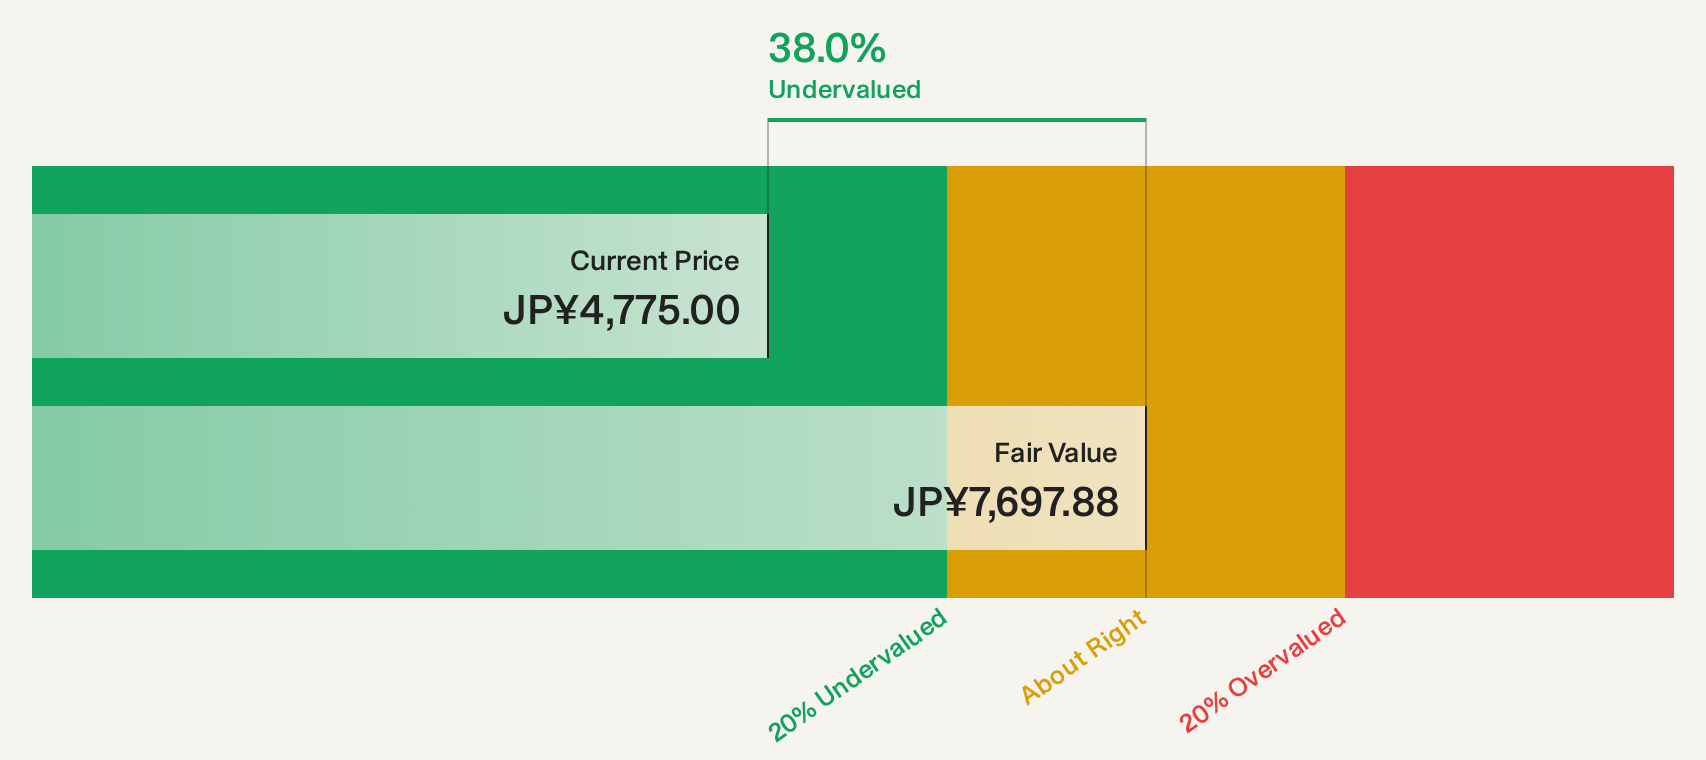
Estimated Discount To Fair Value: 38.2%
SRA Holdings is trading at 38.2% below its estimated fair value and more than 20% below future cash flow value, making it potentially undervalued based on cash flows. The company has announced a share repurchase program worth ¥4.3 billion to enhance shareholder returns and capital efficiency. Despite a high dividend yield of 4.61%, earnings growth forecasts are modest at 2.28% per year, trailing the Japanese market's projected growth rate of 8.8%.
- Our expertly prepared growth report on SRA Holdings implies its future financial outlook may be stronger than recent results.
- Click to explore a detailed breakdown of our findings in SRA Holdings' balance sheet health report.
SuzukiLtd (TSE:6785)
Overview: Suzuki Co., Ltd. manufactures and sells connectors for car electronics parts in Japan, with a market cap of ¥44.59 billion.
Operations: The company's revenue segments include Die at ¥2.44 billion, Parts at ¥30.82 billion, Rental at ¥367.96 million, and Machinery and Appliances at ¥7.45 billion.
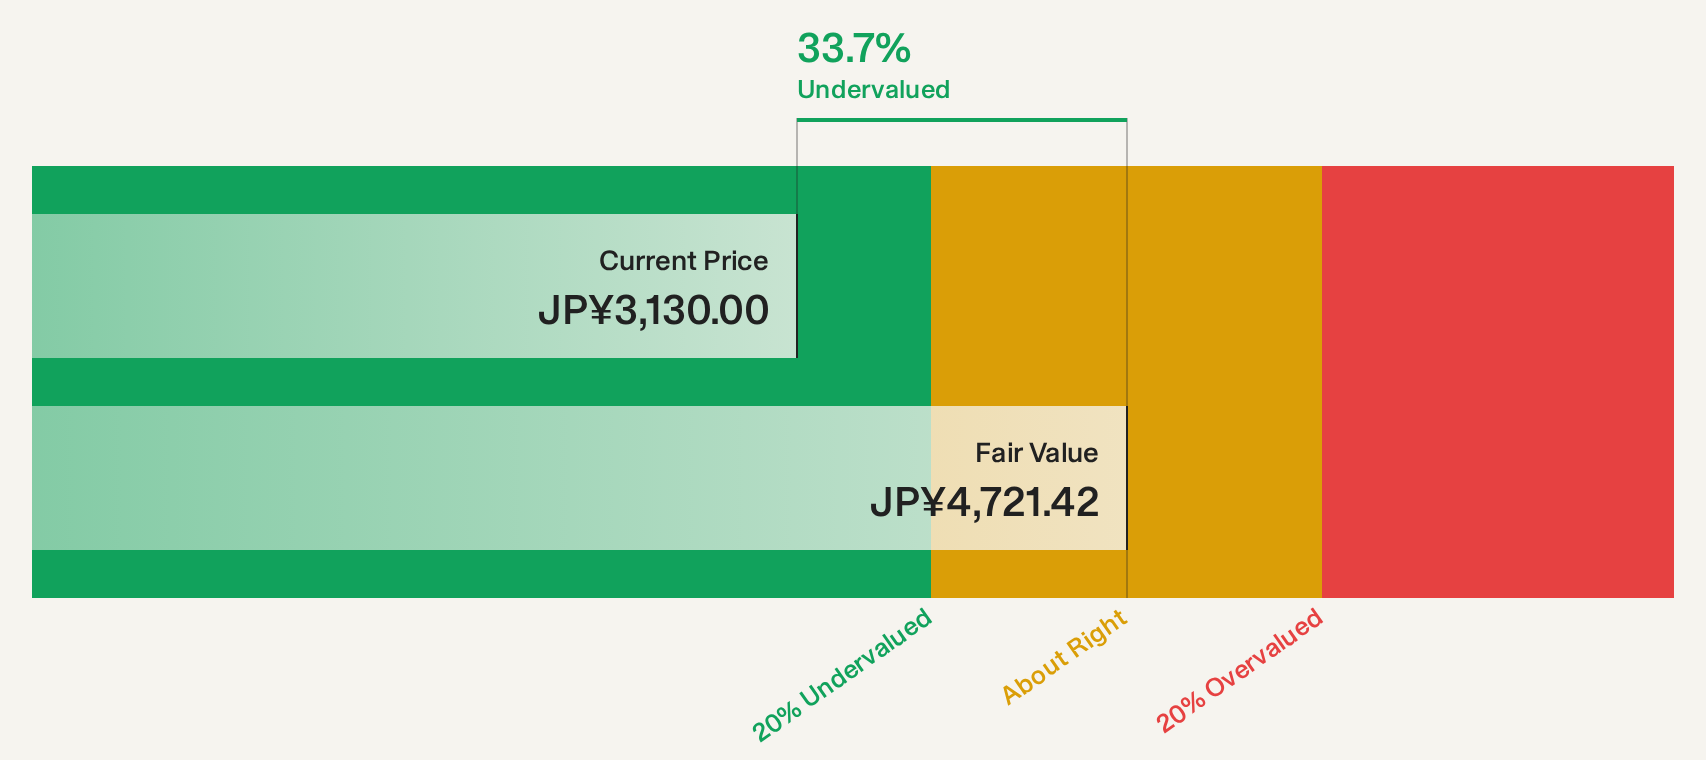
Estimated Discount To Fair Value: 34.5%
Suzuki Co., Ltd. is trading 34.5% below its estimated fair value and more than 20% under future cash flow value, suggesting potential undervaluation based on cash flows. Recent earnings show significant growth, with sales reaching ¥40.45 billion and net income at ¥3.75 billion for the year ended June 2026. However, revenue growth forecasts of 4.9% per year lag behind the Japanese market average of 6.4%, and dividend stability remains a concern despite recent increases in payouts.
- Our earnings growth report unveils the potential for significant increases in SuzukiLtd's future results.
- Navigate through the intricacies of SuzukiLtd with our comprehensive financial health report here.
Maruzen Showa Unyu (TSE:9068)
Overview: Maruzen Showa Unyu Co., Ltd. operates in the logistics sector both domestically in Japan and internationally, with a market cap of ¥139.96 billion.
Operations: The company generates revenue primarily from its Logistics Business, accounting for ¥130.92 billion, and from its On-Site Work and Mechanical Cargo Handling Business, contributing ¥16.97 billion.
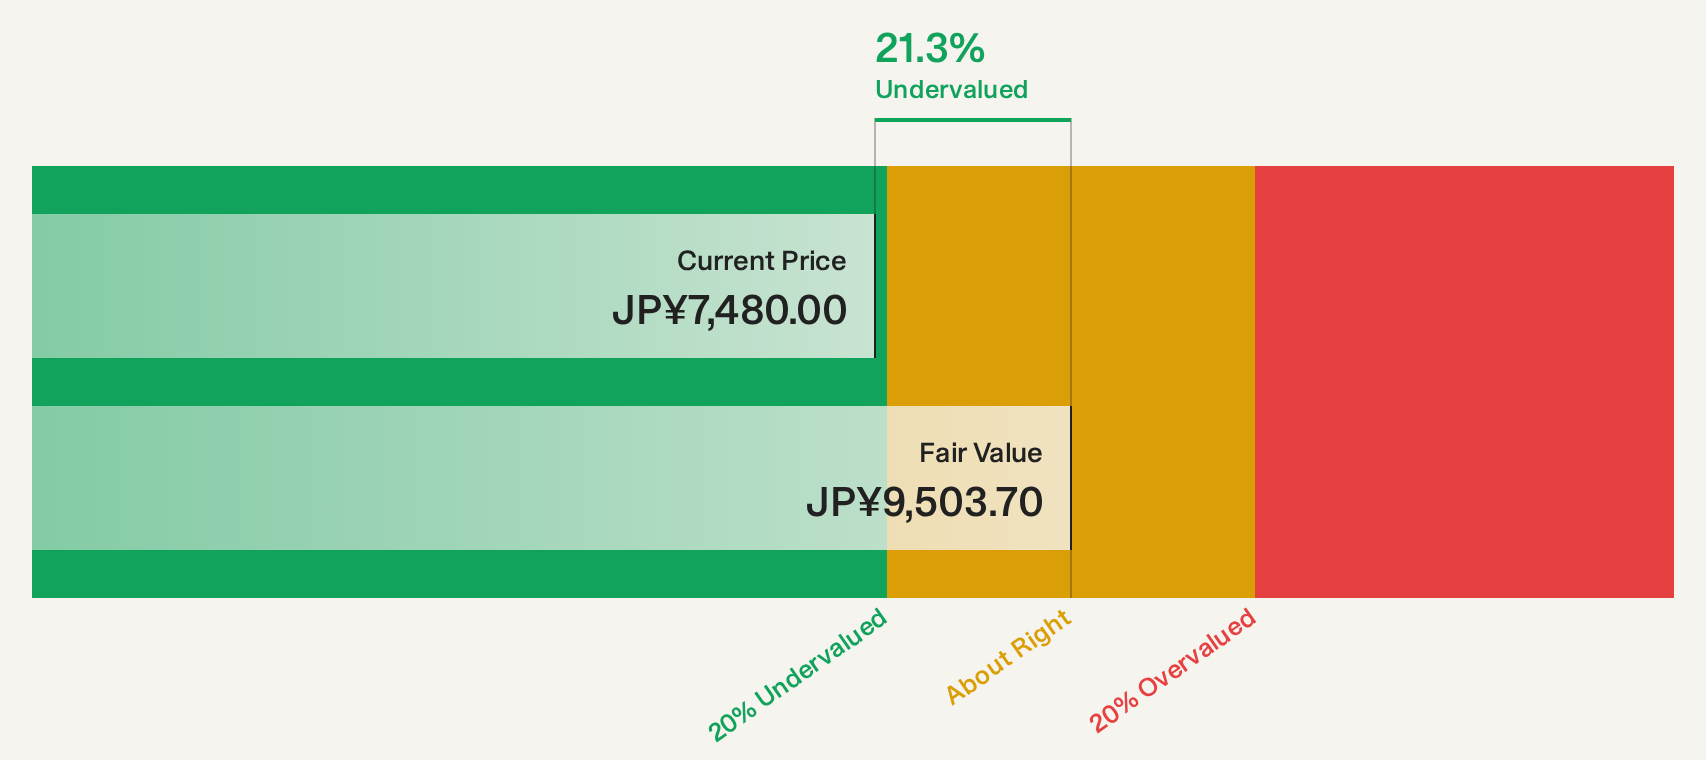
Estimated Discount To Fair Value: 23.2%
Maruzen Showa Unyu is trading 23.2% below its estimated fair value and more than 20% under future cash flow value, indicating potential undervaluation based on cash flows. Earnings grew by 24.1% last year, yet the forecasted annual profit growth of 1% lags behind the Japanese market average of 8.8%. Recent changes include a share split and amended articles of incorporation, while dividend guidance shows instability with adjustments for a stock split effective October 2026.
- Insights from our recent growth report point to a promising forecast for Maruzen Showa Unyu's business outlook.
- Get an in-depth perspective on Maruzen Showa Unyu's balance sheet by reading our health report here.
Seize The Opportunity
- Investigate our full lineup of 83 Undervalued Asian Stocks Based On Cash Flows right here.
- Shareholder in one or more of these companies? Ensure you're never caught off-guard by adding your portfolio in Simply Wall St for timely alerts on significant stock developments.
- Take control of your financial future using Simply Wall St, offering free, in-depth knowledge of international markets to every investor.
Curious About Other Options?
- Explore high-performing small cap companies that haven't yet garnered significant analyst attention.
- Diversify your portfolio with solid dividend payers offering reliable income streams to weather potential market turbulence.
- Fuel your portfolio with companies showing strong growth potential, backed by optimistic outlooks both from analysts and management.
This article by Simply Wall St is general in nature. We provide commentary based on historical data and analyst forecasts only using an unbiased methodology and our articles are not intended to be financial advice. It does not constitute a recommendation to buy or sell any stock, and does not take account of your objectives, or your financial situation. We aim to bring you long-term focused analysis driven by fundamental data. Note that our analysis may not factor in the latest price-sensitive company announcements or qualitative material. Simply Wall St has no position in any stocks mentioned.
Have feedback on this article? Concerned about the content? Get in touch with us directly. Alternatively, email editorial-team@simplywallst.com