
Hang Lung Group (SEHK:10) Opens Amoy Footbridge On A Valuation Story That Still Looks Mixed
Hang Lung Group (SEHK:10) has drawn fresh attention after its subsidiary inaugurated the Amoy Footbridge in Kowloon Bay, a fully funded pedestrian link that tightens connections between nearby retail, cultural and transport hubs.
For shareholders, the Amoy Footbridge opening arrives after a mixed period for Hang Lung Group, with the share price at HK$12.46 and a year-to-date share price return down 18.56%, while the 3-year total shareholder return of 42.11% points to stronger longer term momentum.
Scan beyond Hang Lung Group and see how other real estate players with firm balance sheets are pricing long-term projects like Amoy Footbridge using our curated list of solid balance sheet and fundamentals (195 results)
Against that backdrop of recent share price weakness, and a fully funded long term project like Amoy Footbridge, does Hang Lung Group now offer a skewed risk reward, or is the valuation already reflecting that commitment?
Price-to-Earnings of 12x for Hang Lung Group: Is it justified?
On the numbers alone, Hang Lung Group trades on a P/E of 12x while the broader Hong Kong real estate sector sits closer to 8.9x. This means the stock is priced at a premium multiple even after recent share price weakness.
P/E compares what you pay today to the earnings the business is currently generating. For a property developer and landlord like Hang Lung Group, it reflects how the market weighs recurring rental income, property sales and hotel profits against current earnings quality.
That premium against the sector is not uniform though. Hang Lung Group screens as good value versus a peer group average P/E of 24x, suggesting the market is applying a lower earnings multiple than many directly comparable real estate stocks while still pricing it above the industry mean.
Investors are looking at a mixed signal. The stock appears expensive against the Hong Kong real estate industry average, yet comparatively cheap versus closer peers. The market could be paying up for perceived quality or balance sheet strength while still discounting weaker recent earnings trends and a low 1.5% return on equity.
See what the numbers say about this price — find out in our valuation breakdown.
Result: Price-to-Earnings of 12x (ABOUT RIGHT)
Still, the story can change quickly if weaker Hong Kong property sentiment deepens or if Hang Lung Group faces slower leasing demand across key Chinese mainland assets.
Find out about the key risks to this Hang Lung Group narrative.
Another view on Hang Lung Group's value
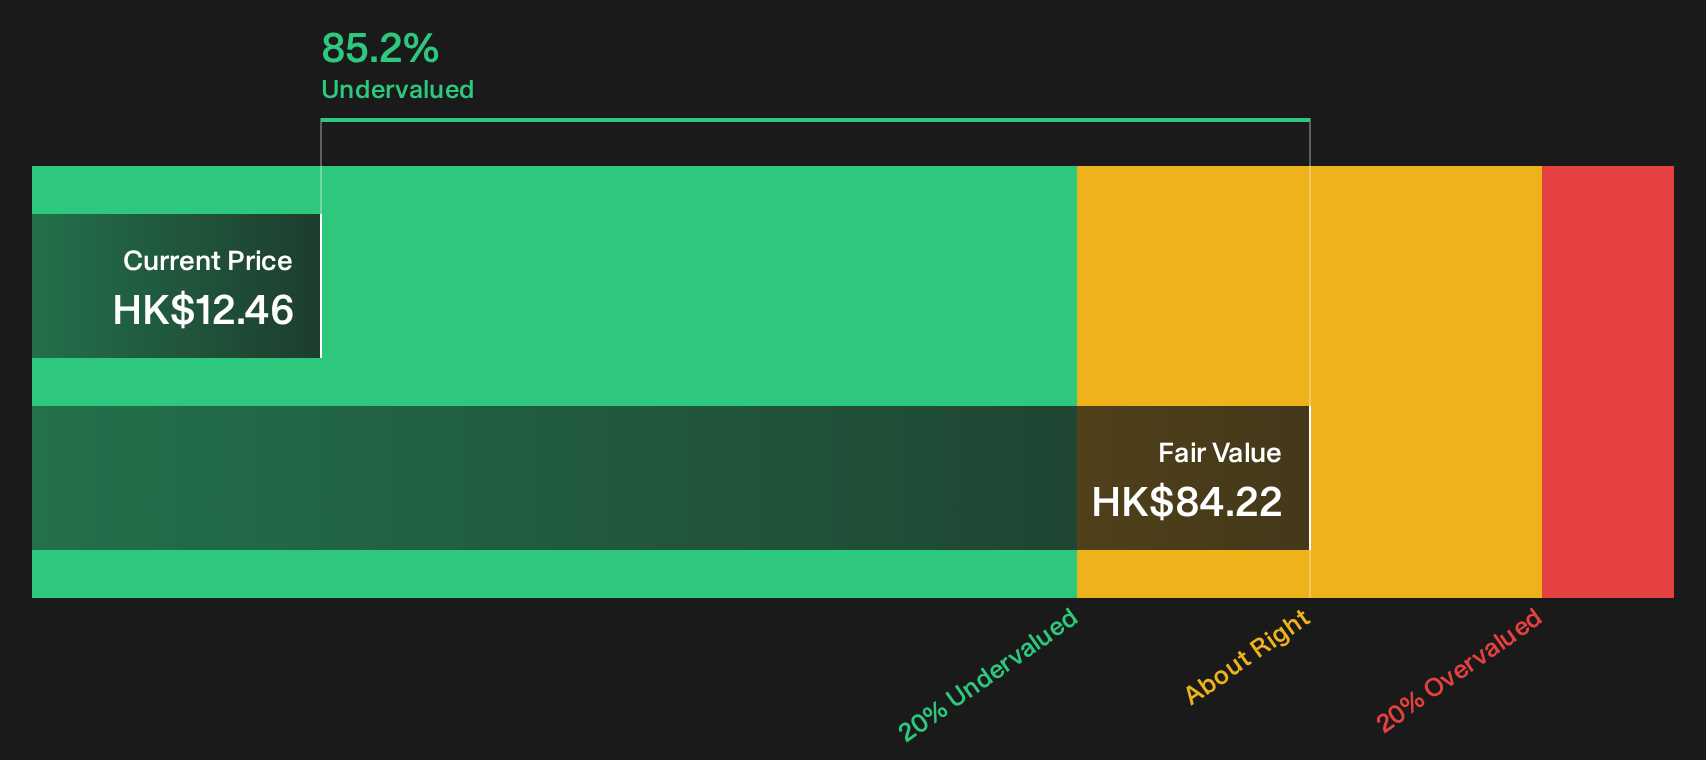
On a different yardstick, the SWS DCF model paints a very different picture for Hang Lung Group. With the share price at HK$12.46 and the estimated future cash flow value at HK$84.22, the stock screens as heavily undervalued, trading about 85.2% below that figure. Is the market missing something, or is the model overly optimistic?
Look into how the SWS DCF model arrives at its fair value.
Simply Wall St performs a discounted cash flow (DCF) on every stock in the world every day (check out Hang Lung Group for example). We show the entire calculation in full. You can track the result in your watchlist or portfolio and be alerted when this changes, or use our stock screener to discover 192 high quality undervalued stocks. If you save a screener we even alert you when new companies match - so you never miss a potential opportunity.
Next Steps
Mixed signals or clear opportunity for Hang Lung Group? If you want to move quickly and form your own view based on both the concerns and potential upside that other investors are weighing, start with the 2 key rewards and 2 important warning signs.
Looking for more investment ideas beyond Hang Lung Group?
If you are serious about sharpening your portfolio, do not stop with Hang Lung Group. The right mix of quality, value and resilience often starts with a wider watchlist.
- Target potential mispricing and hunt for businesses that combine solid fundamentals with appealing valuations using the 192 high quality undervalued stocks.
- Strengthen your income stream by focusing on companies that aim to deliver reliable cash payouts through the 163 dividend fortresses.
- Protect your downside by concentrating on businesses that score well on stability and risk controls with the 103 resilient stocks with low risk scores.
This article by Simply Wall St is general in nature. We provide commentary based on historical data and analyst forecasts only using an unbiased methodology and our articles are not intended to be financial advice. It does not constitute a recommendation to buy or sell any stock, and does not take account of your objectives, or your financial situation. We aim to bring you long-term focused analysis driven by fundamental data. Note that our analysis may not factor in the latest price-sensitive company announcements or qualitative material. Simply Wall St has no position in any stocks mentioned.
Have feedback on this article? Concerned about the content? Get in touch with us directly. Alternatively, email editorial-team@simplywallst.com