
Chubb (CB) Rises Before Earnings But Is The Valuation Story Already Priced In
Chubb (CB) moved higher while the broader market slipped, drawing attention ahead of its upcoming earnings report as traders weigh forecasts for lower EPS alongside expectations for higher year over year revenue.
The current US$341.86 share price comes after a mixed few months, with a 7 day share price return of 1.55%, a slightly negative 30 day move, and a 4.24% share price return over 90 days. The 1 year total shareholder return of 27.22% and 5 year total shareholder return of 109.11% point to momentum that has built gradually over time as investors reassess Chubb’s earnings power and risk profile.
See how Chubb compares to a hand-picked 11 resilient stocks with low risk scores that have held up when markets turned choppy.
After a strong 1 year run and triple digit 5 year returns, the live question on Chubb is whether US$341.86 still leaves real upside on the table or already reflects most of the story ahead of earnings.
Most Popular Narrative: 6.6% Undervalued
Against Chubb’s last close of $341.86, the most followed narrative pegs fair value at $365.87, leaving a modest valuation gap that analysts link directly to its cash flow profile and risk assumptions.
Capital deployment through ongoing share repurchases (new $5b authorization), growing dividends, and selective M&A is creating upward pressure on earnings per share (EPS), while robust cash flow and capital position provide flexibility for further shareholder returns.
Growth in specialized insurance demand such as cyber and high-net-worth personal lines, driven by macro trends (digitalization, greater risk exposures, climate-driven catastrophes), positions Chubb to leverage expertise and scale for above-industry-average topline and earnings growth.
See why 77 investors see Chubb as 7% undervalued.
Result: Fair Value of $365.87 (UNDERVALUED)
Still, pressure from rising litigation costs and elevated catastrophe losses could quickly test the bullish Chubb narrative if claims trends move against recent expectations.
Find out about the key risks to this Chubb narrative.
Another View On Chubb Valuation
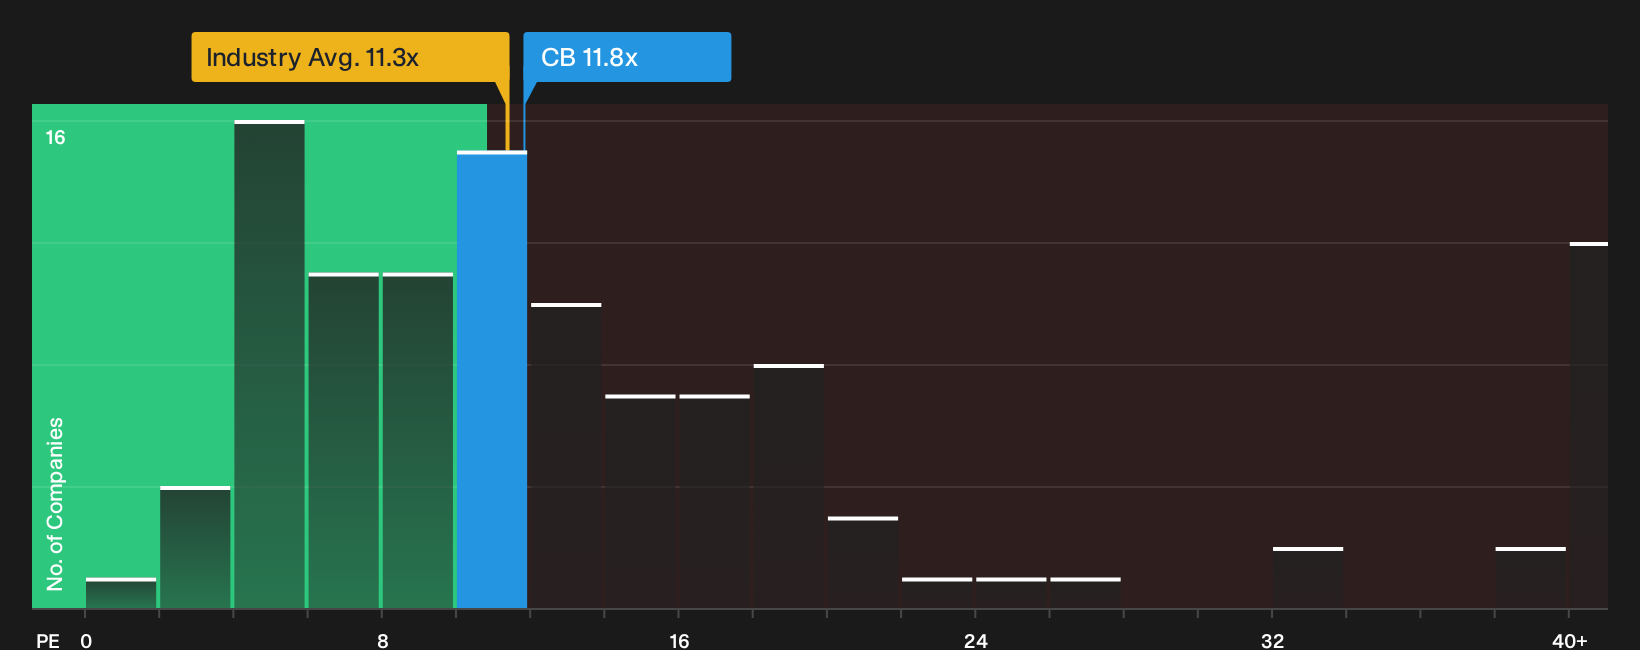
The story flips when you look at Chubb through its P/E ratio instead of that 6.6% gap to fair value. The shares trade on 11.8x earnings, which is higher than the US Insurance industry at 11.3x and above the peer average of 8.6x.
Even against the Simply Wall St fair ratio of 11.5x, the current multiple comes in richer. That premium may signal confidence in Chubb’s track record, or it may just narrow the margin of safety for new money. Which side of that trade-off do you think you are on?
See what the numbers say about this price — find out in our valuation breakdown.
Next Steps
Sentiment around Chubb is clearly split, which is exactly when it can be useful to act quickly and test the story against your own research. To weigh both sides with a balanced view of upside and downside, start by checking the 2 key rewards and 2 important warning signs.
Looking for more investment ideas beyond Chubb?
If Chubb has sharpened your thinking, do not stop there. Fresh ideas often come from comparing strong businesses across different risk, income, and value profiles.
- Accelerate your hunt for potential bargains by reviewing a 34 high quality undervalued stocks that combine solid fundamentals with pricing that may not fully reflect their financial profile.
- Strengthen your income stream by scanning a curated 6 dividend fortresses that offer substantial yields with supporting balance sheets and cash flows.
- Dial down portfolio stress by focusing on a list of solid balance sheet and fundamentals (22 results) so you are not relying on fragile finances when markets turn rough.
This article by Simply Wall St is general in nature. We provide commentary based on historical data and analyst forecasts only using an unbiased methodology and our articles are not intended to be financial advice. It does not constitute a recommendation to buy or sell any stock, and does not take account of your objectives, or your financial situation. We aim to bring you long-term focused analysis driven by fundamental data. Note that our analysis may not factor in the latest price-sensitive company announcements or qualitative material. Simply Wall St has no position in any stocks mentioned.
Have feedback on this article? Concerned about the content? Get in touch with us directly. Alternatively, email editorial-team@simplywallst.com