
How Component Cost Fears Will Impact Universal Display Stock Investors
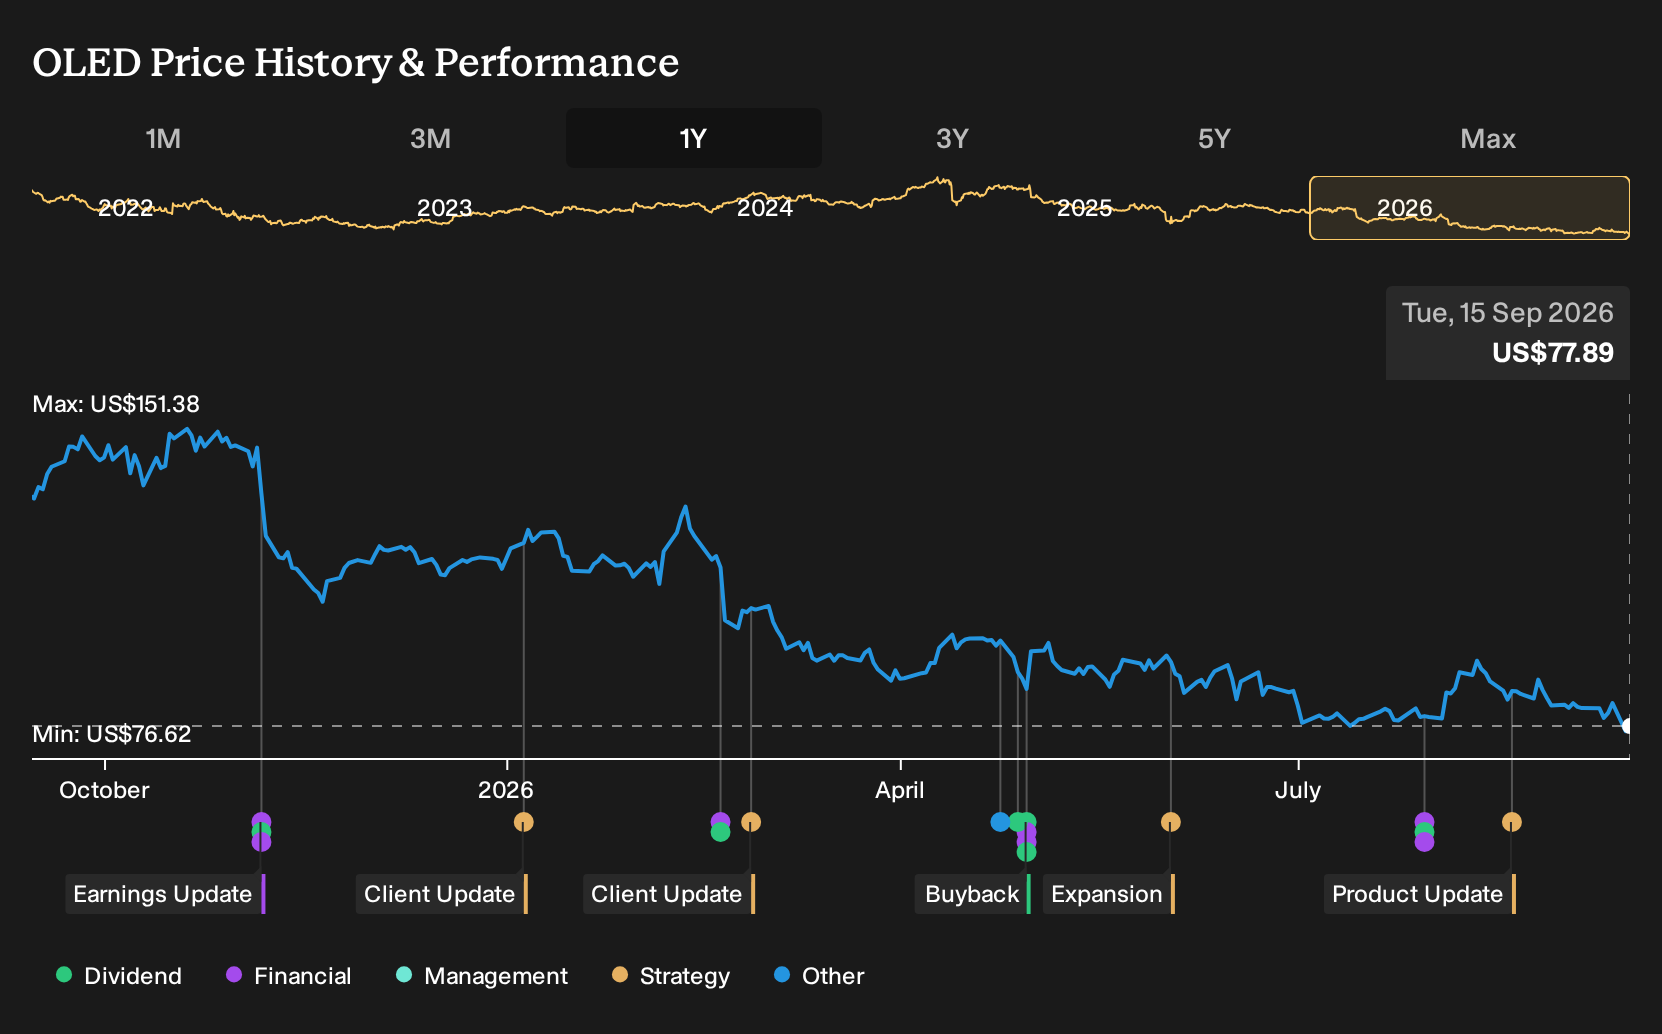
- Universal Display has come under pressure after a sector-wide selloff in electronic component makers, alongside fresh short-seller commentary flagging risks from higher input costs and softer consumer electronics demand during key selling periods.
- The short thesis focuses on a potential mismatch between Universal Display’s forward-looking forecasts and a consumer hardware market that may face tighter budgets and rising component prices, which could affect material shipments and royalty-driven revenue.
- We will now examine how Universal Display's investment narrative compares with concerns that higher tech component costs could restrain device demand.
Benchmark your view on Universal Display against other potential beneficiaries or casualties of rising tech input costs by scanning our hand-picked 59 AI infrastructure stocks in the current AI build-out cycle.
Universal Display Investment Narrative Recap
To own Universal Display, you need to be comfortable with a story built on wider OLED adoption in IT, automotive and premium consumer devices, supported by proprietary materials and licensing income. In the near term, the key swing factor is how quickly panel makers translate planned fab investments into consistent material orders, given already variable buying patterns from major Asian customers.
The recent sector selloff and the short thesis around higher component costs have mostly affected expectations rather than operations. The immediate risk remains that softer consumer electronics budgets or tariff-related pull-forwards keep material shipments choppy. If ordering volatility persists, that would weigh on margins and make the current year revenue guidance harder to achieve.
The Prosper Stars & Stripes short commentary is the clearest recent datapoint because it connects Universal Display directly to the AI capex boom and the possibility that consumer hardware spending gets squeezed. That critique leans on a view that back-to-school and holiday seasons could see pressure if device makers face higher bills of materials and cautious shoppers at the same time.
For investors, the link to catalysts is straightforward. If OLED adoption in laptops, monitors and foldables progresses as panel capacity ramps, it can help offset weaker volumes in more mature smartphone categories. If AI-related component cost inflation or slower IT device uptake disrupt those rollouts, then the potential upside from new fabs, blue emitters and foldable form factors could take longer to appear in Universal Display’s material sales and royalty streams.
Universal Display Forecasts Against Short-Seller Concerns
Universal Display's narrative projects US$817.1 million in revenue and US$271.1 million in earnings by 2029, built on analyst assumptions of 9.3% yearly revenue growth and an earnings increase of about US$57.7 million from US$213.4 million today.
The short argument that rising component costs could squeeze consumer devices lands directly against these consensus numbers. Analysts are effectively assuming that panel and device makers keep rolling out OLED-heavy products fast enough for Universal Display to grow both revenue and profit, even if margins ease from 34.1% today to 33.2% in three years.
That forecast implies a business that sells more material into the supply chain and collects higher royalties, but at a slightly lower profitability per dollar of sales. If component inflation or weaker device demand interrupts that flow, the pressure would likely show up first in the timing of material orders rather than in headline revenue targets, at least initially.
Short sellers are questioning whether a consumer hardware market dealing with higher bills of materials can support the transition from US$213.4 million of earnings today to US$271.1 million by 2029 without bumpier quarters than analysts are baking in. The concern is not just about the destination but about the path, with back to school and holiday seasons flagged as flashpoints where cautious buyers and higher input prices could collide.
For readers comparing Universal Display to other suppliers into the AI and consumer electronics stack, the key takeaway is simple. Consensus numbers assume that OLED adoption, fab buildouts and new blue emitter deployments outweigh the drag from any cost inflation or device softness, while the short thesis leans on the idea that this balance could tilt the other way during key selling windows.
Uncover how Universal Display's fair value indicates a 64% potential upside to its current price before the market closes the gap.
Exploring Other Perspectives
One alternate angle on Universal Display leans heavily on phosphorescent blue timing. The most pessimistic analysts think commercialization could lag customer priorities and keep the story closer to earnings of about US$195.6 million today, reaching roughly US$292.4 million by 2029 on revenue of about US$804.3 million. These pre selloff estimates show how far opinions can stretch. Use this spread as a prompt to explore several viewpoints before deciding how the recent short commentary might reshape the narrative.
Explore 4 other Universal Display fair value estimates, including one that suggests as much as 50% downside from the current price!
The Verdict Is Yours
Don't just follow the ticker; dig into the data and build a conviction that's truly your own.
- A great starting point for your Universal Display research is our analysis highlighting 4 key rewards and 1 important warning sign that could impact your investment decision.
- See our latest analysis for Universal Display. The report includes a comprehensive fundamental analysis summarized in a single visual, the Snowflake, making it easy to evaluate Universal Display's overall financial health at a glance.
Looking For More Ideas Beyond Universal Display?
If the Universal Display story has sharpened your thinking about where to put fresh capital, it can help to line it up against other opportunities using a structured stock filter rather than jumping from ticker to ticker on headlines alone.
- For readers who want quality at a discount, scan a curated set of potentially mispriced companies through our 34 high quality undervalued stocks to see which ones match your return and risk expectations.
- If capital protection sits high on your priority list, use the 11 resilient stocks with low risk scores to focus on businesses with more resilient characteristics and lower assessed risk scores.
- When you are hunting for future leaders before they are widely followed, broaden your watchlist with a 16 high quality undiscovered gems that filters for stronger fundamentals hiding in plainer sight.
This article by Simply Wall St is general in nature. We provide commentary based on historical data and analyst forecasts only using an unbiased methodology and our articles are not intended to be financial advice. It does not constitute a recommendation to buy or sell any stock, and does not take account of your objectives, or your financial situation. We aim to bring you long-term focused analysis driven by fundamental data. Note that our analysis may not factor in the latest price-sensitive company announcements or qualitative material. Simply Wall St has no position in any stocks mentioned.
Have feedback on this article? Concerned about the content? Get in touch with us directly. Alternatively, email editorial-team@simplywallst.com