
The raging price of oil has set off a storm in yield! When the “anchor of asset pricing” hovers around 5%, high-grade bonds and “Apple” high-quality cash flow return to the spotlight
The geopolitical conflict in the Middle East triggered by the US-Iran war at the end of February seems to be escalating from strait passage risk to an unprecedented global energy supply shock compounded by “straits blocked, alternative routes threatened, and bypass pipelines interrupted.” The Houthis seized Moka Port and Perim Island, and further controlled the Hanish Islands; Saudi Arabia launched air strikes to counter, and the security risks faced by Red Sea energy exports continued to expand.
Meanwhile, the Saudi east-west oil pipeline, which is tasked to bypass the Strait of Hormuz, was attacked and stopped. The pipeline recently transported about 4 million to 5 million barrels of crude oil. The energy shock immediately spread to the global discount rate system — on September 15, the yield on 10-year US Treasury bonds, which have the title of “the anchor of global asset pricing”, hit a record high of 5.041% in the intraday period, a record high since 2007. The sharp rise in 10-year US bond yields has also caused risky assets such as the stock market to be hit hard recently.
After 10-year US Treasury yields break the critical threshold of 5% again, it is more likely to begin a period of high tension and accelerated differentiation in asset performance. Especially before the energy shock and America's continuing sharp fiscal deficit ease significantly, the conditions for quickly replicating the sharp decline in yield at the end of 2023 are insufficient.
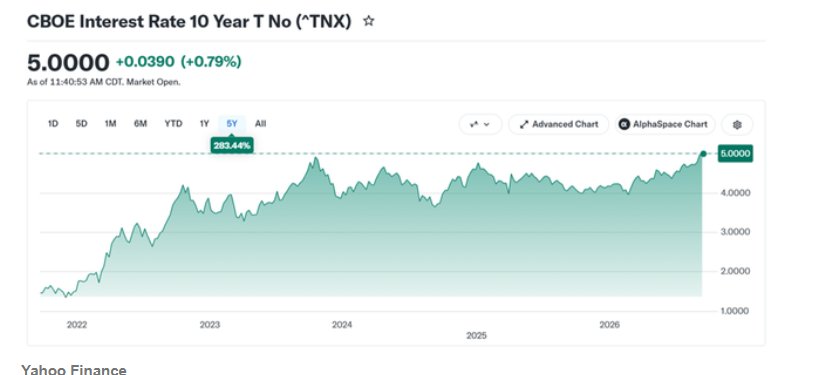
At a time when the yield on 10-year US bonds is hovering around 5%, the traditional 60/40 diversified investment strategy of stock bonds may still face major challenges. A broader risk-parity portfolio may be more suitable than the 60:40 allocation of equity bonds to the current macro background of a high yield curve. From the perspective of active asset allocation, the 5% 10-year treasury bond yield has greatly improved the expected return prospects for high-quality fixed income assets. A sustained high-yield environment is conducive to long-term stable and high-quality enterprises with a strong pace of cash flow generation and long-term stable and high-quality enterprises with self-financing metallicity, while putting pressure on speculative and long-term growth stocks.
Saudi Arabia has spent a huge amount of money to build an east-west pipeline — that is, crude oil transferred to Yanbu recently is about 4 million barrels per day. However, the reality is that Yanbu Depot has experienced a new round of strong suppression by the Houthis, and this inventory is expected to only maintain exports for 5 to 7 days, which means that the essential bypass pipeline and an alternative route to the Strait of Hormuz — shipping in the Strait of Mander has almost stopped compared to before the outbreak of the war. If the Saudi oil shutdown continues until stocks are insufficient to support shipping, around 4% of the world's energy supply could be threatened.
The core logic behind the sharp rise in crude oil and refined oil prices in this round is that navigation in Hormuz, which is responsible for 20% of global energy supply, has not yet returned to normal, and that the Saudi-led Mander Strait energy transportation system and other shipping and land pipelines outside the Strait of Hormuz, which are responsible for the replacement export function of the Middle East Gulf oil and gas producers, were interrupted one after another by the Houthis military. The market needed to re-evaluate the quantity and recovery time of oil and gas that can be delivered. These many adverse factors surrounding geopolitics drove Brent crude oil to continue to rise this week. At the end of February, it was close to the 110 US dollar mark. war Up to now, the increase is over 60%.
Oil prices ignited interest rate turmoil, and the “anchor of global asset pricing” broke through 5%! What are the likely winners and losers in a high-yield environment?
The US Secretary of Energy has determined that oil transportation may be resumed within a few days, while other sources disclosed by insiders estimate that the full restoration may take five to six weeks, during which time some capacity may be restored. Determining the continuation of the impact on oil prices is not only when facilities will restart, but also whether actual export volume can recover steadily.
This market repricing, which revolves around energy inflation and the unprecedented interruption of oil supply in human society, has spread across the board to the global long-term treasury bond market. On September 15, the 10-year US Treasury yield hit an intraday high of 5.041%, a record high since 2007; Japan's 10-year Treasury yield rose to a 30-year high of about 3.04%, and the country's 30-year Treasury yield also hit an all-time high of about 4.21% in September;; German 10-year Treasury yields rose to 3.572%, a record high since 2009.
From the perspective of the pricing mechanism, the market is under upward pressure from energy inflation, policy interest rate expectations, and long-term debt risk compensation; even if the interest rate hike itself has been largely digested, whether it continues to be tightened in the future, whether inflation can fall back, and whether fiscal deficits and interest expenses expand further, it may still trigger new price fluctuations.
The pressure on Japan's long-term debt is also compounded by expectations of normalization of domestic monetary policy and expectations for a new round of large-scale fiscal stimulus policies prepared by the Takaichi Sanae government. Therefore, although the yield of each country is rising, the main driving factors do not completely overlap, the common denominators all focus on the continued high inflation expectations brought about by the continued rise in energy prices and the surge in long-term treasury bond maturity premiums due to the accelerated expansion of fiscal deficits.
As of September 16, local time, before the announcement of the Federal Reserve's FOMC interest rate decision, interest rate futures market pricing data showed that traders agreed that the implied probability that the Federal Reserve announced a 25 basis point rate hike at the current FOMC monetary policy meeting was about 93%, compared to 61.2% a week ago.
The 10-year US Treasury is known as the “anchor of global asset pricing,” stemming from its benchmark position in the US dollar financing system and medium- to long-term cash flow valuation. The US Treasury bond market is large and active in trading, and the US dollar is widely used in international financing and reserves, so changes in yield have cross-market effects — US dollar corporate bonds usually refer to the yield of US bonds with similar maturity and compounded by credit spreads. Housing mortgage interest rates are affected by the pricing of treasury bonds and mortgage-backed securities, and stock and real estate valuations are highly sensitive to future cash flow discount rates.
From a theoretical perspective, the 10-year US Treasury yield is equivalent to the risk-free interest rate indicator r on the denominator side of the DCF valuation model, an important valuation model in the stock market. Other indicators (especially the molecular side's cash flow expectations) have not changed significantly — for example, during the earnings season, the molecular side is in a vacuum due to lack of active catalysts. At this time, if the denominator level is higher or continues to operate in historically extremely high regions above 5%, the valuations of risky assets such as technology stocks, high-yield corporate bonds, and cryptocurrencies that are closely related to AI are facing collapse.
Therefore, in a situation where the 10-year US Treasury yield is likely to hover at a historical high of 5% for some time to come, it is not “the US bond yield reaches 5%, and all risk assets should be sold,” but rather distinguishes between price losses caused by continued rising interest rates and long-term investment opportunities brought about by a high yield starting point. The core configuration direction given by Wall Street investment strategy research agency D.M. Martins Research shows that the focus is on companies with high-quality fundamentals and long-term strong cash flow performance, such as Apple (AAPL.US), Microsoft (MSFT.US), and Walmart (WMT.US), and need the world's highest market capitalization company with strong cash flow — that is, the “AI chip hegemon” Nvidia (NVDA.US), the AI computing power theme leader “NVDA.US), and others focusing on AI infrastructure frenzy where the business model has not been verified Speculative growth stocks are clearly distinguished.
This logic about the long-term AI revenue trajectory and whether the cash flow is steady is also the core logic of why the US cloud computing giants performed far better than the Philadelphia Semiconductor Index on Monday. Some of the most central cloud giants (Hyperscalers) in this infrastructure carnival bucked the trend on Monday: Google's parent company Alphabet bucked the trend and closed up more than 3%, Microsoft rose 1.97%, and Meta also rose around 2.7%. Although Amazon closed with a slight decline of 1.26%, its resistance to falling was far superior to that of many chip stocks. They have huge cash flow and can continue to reap ROIC from the facilities they have already built.
As for the bond side, D.M. Martins Research favors high credit quality corporate bonds. Using Apple (AAPL.US) 10-year corporate bonds as an example of individual securities, an investment-grade corporate bond ETF - LQD, as a decentralized allocation tool. What needs to be avoided are companies whose business models have not been fully verified and whose main value depends on cash flow in the distant future in topics such as quantum computing, alternative energy, electric vertical take-off and landing vehicles, and space exploration, rather than indiscriminately denying these industries. For long-term allocations, S&P 500, long-term US Treasury ETFs, gold, commodities, and managed futures strategies (CTAs) can still collectively form candidate assets under the risk parity framework. The investment divide seems to be shifting from “technology or traditional industries that are behind the times” to “whether cash flow has been realized, or is it still necessary to rely on future financing and long-term commitments.”
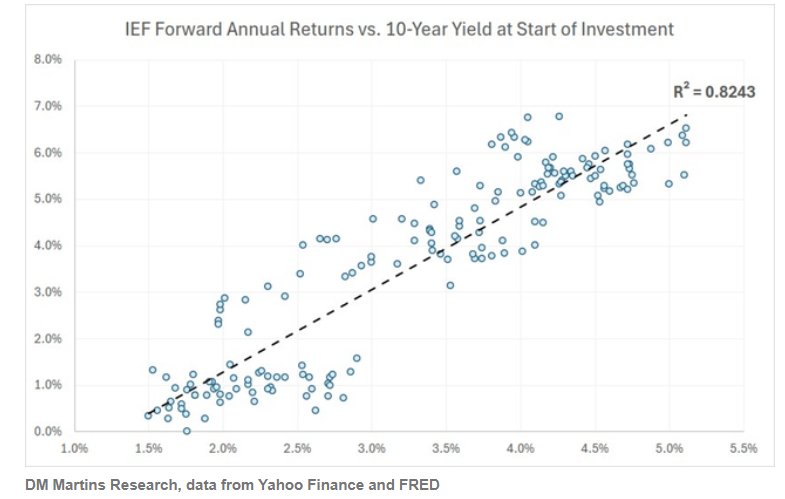
D.M. Martins Research said that the reason why high long-term US bond yields may be beneficial to fixed income investments is because in the long run, the annualized return on bonds issued by issuers with extremely high credit quality is almost equal to the return at the time of investment. Even the funds that hold these bonds have this kind of relationship.
The scatter chart below shows the relationship between the future return of a bond fund and the return at the time of initial investment. Note that the iShares 7-10 year US Treasury ETF (IEF.US) currently has a weighted average term of 8.5 years, and its average annualized return over a 10-year holding period has always been very close to the 10-year US Treasury yield at the beginning of this 10-year period. D.M. Martins Research said the conclusion from this is that a higher interest/yield curve is likely — and likely — to mean a higher expected return on investment in the future.
Within the investment range of investment-grade bonds, capital often favors corporate bonds with extremely high credit quality during periods of high yield. Today, the issue of rising government debt, particularly the federal government debt, is generating a fuzzy yet very real debate, and the negative effects of continuing budget deficits and high interest rates are exacerbating the problem. Although all credit rating agencies rate US federal government debt near the highest credit quality rating, the relevant narrative — which also extends to foreign policy and trade policy — does not seem to fully fit the concept of conservative investment.
At the same time, a high-cash-flow, defensive, high-quality fundamental company such as Apple (AAPL.US) has a strong balance sheet, generates large amounts of free cash flow every year, has high-quality corporate governance, and has prudent capital expenditure arrangements, and its 10-year bonds also provide a spread of 20 basis points compared to US Treasury bonds over the same period. Although not much, it is also encouraging. Building a basket of bonds issued by such powerful companies may be achieved through funds such as the iShares iBoxx US Dollar Investment Grade Corporate Bond ETF (LQD), so even the credit risk unique to quite a few issuers can be increased and reduced through diversification of investment.
In terms of stocks, D.M. Martins Research believes that speculative growth stories could be a loser. Companies like Nvidia (NVDA) — which currently anticipate earnings per share to grow at a rate of 44% per year over the next five years — probably don't fall into this category because their business is closely linked to long-term structural trends and is actively involved, and these trends have unfolded strongly and are clearly reflected in the company's profit and loss statement and cash flow statement. By contrast, D.M. Martins Research refers to companies whose business models have not been fully validated: although their long-term potential is attractive, they are likely to be impacted by the following two aspects: (1) rising expected returns from near-risk-free investments; (2) higher discount rates making cash flows less valuable in the distant future.
To illustrate this, imagine a company's sizable cash flow isn't expected to start appearing until ten years later and beyond. D.M. Martins Research further assumes that there is no debt on its balance sheet, and that it is highly sensitive to the overall stock market — plus some other simplified assumptions to make mathematical calculations — then for every percentage point increase in risk-free interest rates, the company's market value may drop drastically; the risk-free interest rate is broadly defined here as the yield on 10-year US Treasury bonds.
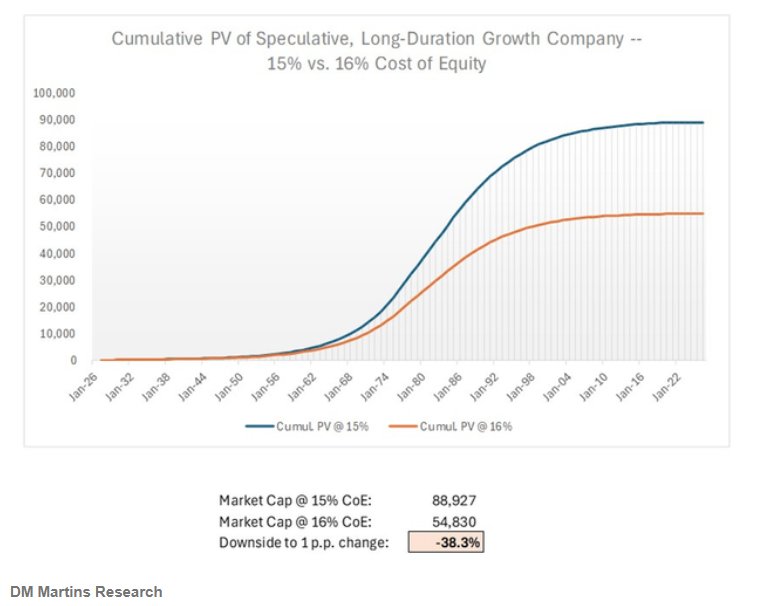
Take a look at the chart above: a mere one percentage point increase in risk-free return is enough to explain a close to 40% decline in market capitalization in terms of valuation. This is why companies in the fields of quantum computing, alternative energy, electric vertical take-off and landing vehicles (eVTOL), and space exploration are investment themes that D.M. Martins Research generally cannot pursue. Of course, if a few companies have compelling reasons to be bullish, unique to the company itself, an exception can also be considered.
Use cash flow and risk parity to rebuild the allocation line of defense without risking interest rate inflection points
A 5% yield means first and foremost an improvement in the starting point for future returns, rather than the fact that bond prices have bottomed out. Yield “rising” and yield “already high” correspond to repricing pressure on existing assets and yield opportunities for new investments, respectively. Both can exist at the same time. The initial yield of high-quality bonds can provide an important reference for long-term returns, but it cannot be understood that the same return can be obtained stably every year in the future; the yield to maturity is also not equal to the actual total return achieved; the latter is still affected by reinvestment conditions, trading timing, and related costs.
For example, let's say the correction period for a bond portfolio is 8 years, and the yield rises by 1 percentage point. The price loss under the first-order approximation is about 8%. This is not yet included in the convex correction, which is enough to significantly offset interest income for that year. Therefore, establishing a bond position requires matching the holding period with the ability to withstand price fluctuations, rather than focusing on long-term bets on “the yield is already very high.”
The real field of stock allocation is growth that can feed itself, and growth that requires continuous financing to sustain itself. Microsoft, Costco, and Walmart were included in the scope of attention, reflecting preferences for operational quality, financing independence, and cash flow resilience; Nvidia was clearly excluded from typical speculative growth stories, reflecting recognition of the structural growth already reflected in profits and cash flow.
An important boundary must be preserved here — the 44% annual increase in earnings per share over the next five years is a Wall Street analysts' forecast for Nvidia. It is not an already realized growth rate, nor can it be directly regarded as an agreed market expectation. Further investment reasoning is that high-quality companies may be better able to absorb high interest rates, but this does not mean that their stocks are cheap at any price; the screening criteria should still cover operating cash flow, capital expenditure requirements, debt maturity structure, and purchase valuation at the same time, and “high-quality companies” cannot automatically be equated with “low risk investments.”
The appeal of high-grade corporate bonds comes from credit quality and income compensation, rather than from breaking away from the sovereign ratio system. The 20-basis point spread on Apple's 10-year corporate bonds compared to US Treasury bonds for the same period is the point-in-time data used in the original draft; the allocation logic is to support credit quality with a strong balance sheet and cash flow, and then obtain a certain amount of additional income.
What is most likely to be subject to valuation compression is the “long-term stock period” where cash flow is remote and commercialization has yet to be verified. When the main cash flow does not appear until ten years later, changes in the discount rate will have a stronger impact on its present value. At the same time, higher near-risk-free returns also increase the opportunity cost for investors to wait for uncertain returns.
The final answer to asset allocation in the context of a 5% yield is to spread risk with assets with different macro-sensitivities while actively choosing strong cash flow+high-quality fundamentals. For active investors, high-quality stocks and credit-screened investment-grade corporate bonds are research directions that are more in line with this framework; for long-term allocators, SPY, TLT, GLD, DBC, and CTA are candidate tools under the risk parity framework, rather than a fixed ratio combination that can be directly copied. This is why D.M. Martins Research emphasizes that further allocation inferences are that equity assets in the stock market bear the risk of long-term growth, long-term treasury bonds reserve exposure to slowing growth and a decline in the interest/yield curve, gold, commodities, and managed futures are used to introduce different sources of risk, and positions are determined by combining risk contribution, correlation, and rebalancing arrangements.