
Mizuno (TSE:8022) Looks Fully Valued As Shares Slip 6% In A Month
Mizuno (TSE:8022) has drawn fresh attention after recent share price moves, with the stock roughly flat over the past week but down about 6% over the past month.
The latest pullback, including a 6% share price decline over the past month, comes after a strong run in recent quarters. The 90 day share price return is 16.38% and the 1 year total shareholder return is 57.08%, suggesting longer term momentum remains intact even as near term enthusiasm cools.
Scan beyond Mizuno and see how it stacks up against other consumer companies with resilient returns using our curated 74 high quality undiscovered gems.
Mizuno has cooled off after a strong run, which leaves a real fork in the road. Has the bulk of the share price gains already played out, or does the current valuation still leave room for more?
Price-to-Earnings of 15.6x: Is it justified?
Mizuno now trades on a P/E of 15.6x, roughly in line with the JP Leisure industry average of 15.6x. This points to a valuation that is neither clearly cheap nor stretched based on peers alone.
The P/E ratio compares the current share price to earnings per share, so it shows how much investors are paying today for each unit of Mizuno's profit. For a consumer durables and sports equipment group like this, the measure is a simple way to connect the share price with the earnings power behind products sold across Japan, Europe, the Americas, and Asia and Oceania.
Earnings have grown by 30.3% over the past year and by 19.3% per year over the past 5 years, with net profit margins at 7.3% compared with 6.2% a year earlier. That backdrop, together with high quality earnings, suggests the market is pricing Mizuno near a level that matches its recent profitability record rather than assigning a steep premium or discount.
Compared with the industry, the stock is described as expensive on a P/E basis versus the JP Leisure average, even though both sit at 15.6x. It is also judged good value against the peer average of 15.8x and the estimated fair P/E of 15.8x. Those fair ratio and peer checks indicate the current multiple is very close to where the market could reasonably gravitate if conditions remain similar.
Explore the SWS fair ratio for Mizuno.
Result: Price-to-Earnings of 15.6x (ABOUT RIGHT)
Still, Mizuno faces clear risks if demand for sports equipment softens, or if profitability in key regions such as Japan and the Americas comes under pressure.
Find out about the key risks to this Mizuno narrative.
Another View on Mizuno: Our DCF Check
The earnings multiple paints Mizuno as roughly fairly priced, yet the SWS DCF model tells a different story. At a share price of ¥4,015 and an estimated future cash flow value of ¥3,398.2, the stock screens as overvalued on this measure. This raises the question of which signal investors should trust.
To see what is baked into those cash flow assumptions and how sensitive the outcome is to small changes, have a look at the Look into how the SWS DCF model arrives at its fair value..
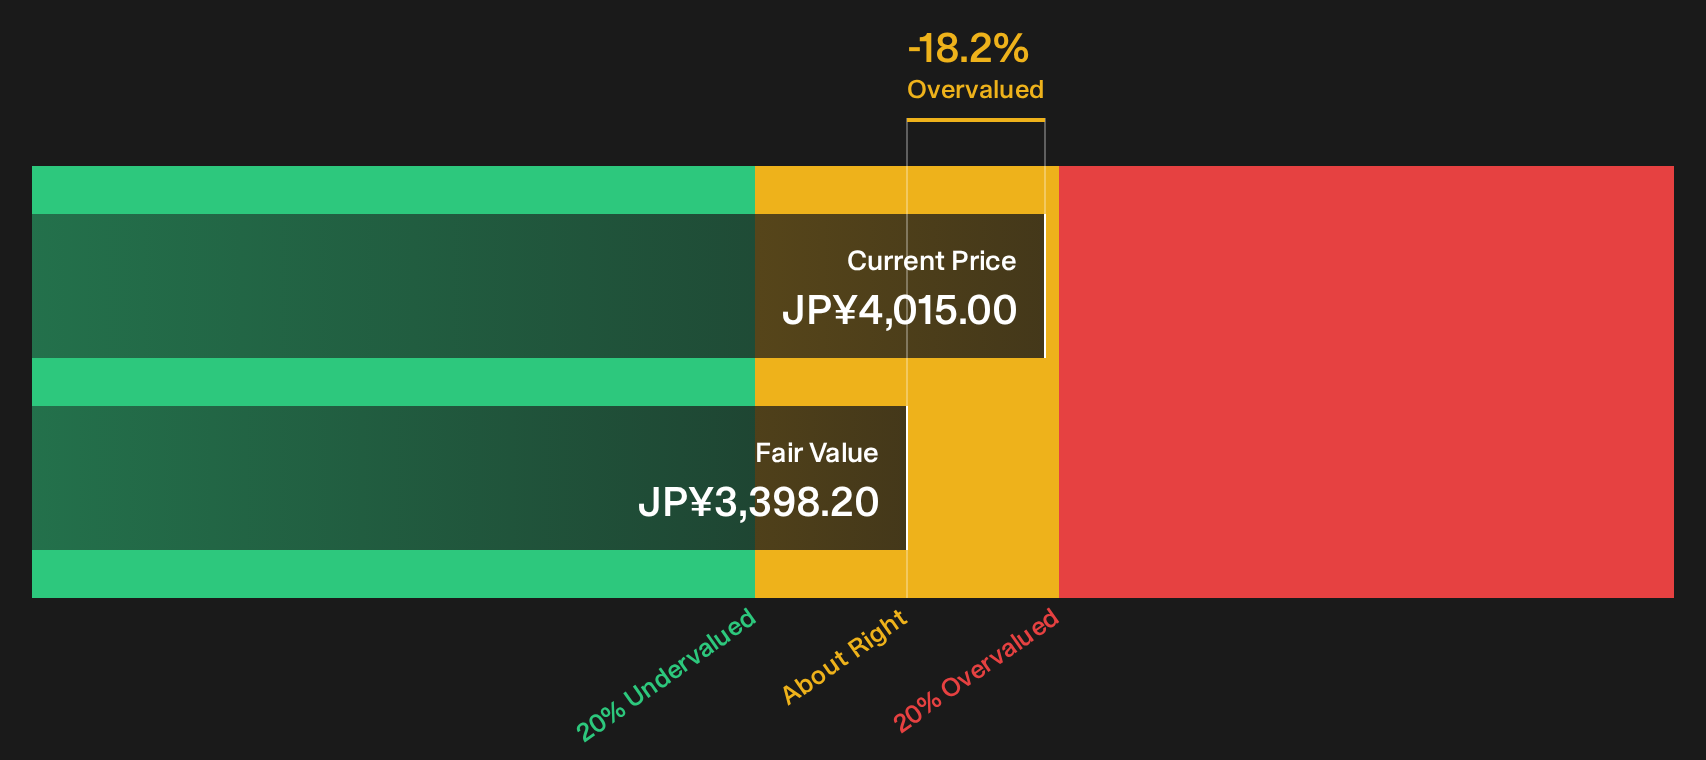
Simply Wall St performs a discounted cash flow (DCF) on every stock in the world every day (check out Mizuno for example). We show the entire calculation in full. You can track the result in your watchlist or portfolio and be alerted when this changes, or use our stock screener to discover 18 high quality undervalued stocks. If you save a screener we even alert you when new companies match - so you never miss a potential opportunity.
Next Steps
If the mixed signals around Mizuno leave you on the fence, now is the time to look through the numbers yourself and test the optimism in the reward profile. To see which specific positives the market is watching, review the 2 key rewards.
Looking for more Mizuno sized investment ideas?
Do not stop with Mizuno. Broaden your watchlist using the Simply Wall Street Screener to surface fresh ideas that fit the way you like to invest.
- Target resilient opportunities that combine quality and attractive pricing through the 18 high quality undervalued stocks.
- Build a portfolio anchored by reliable cash generators using the income focused ideas in the 17 dividend fortresses.
- Protect your capital by concentrating on companies with sturdier finances through the 12 resilient stocks with low risk scores.
This article by Simply Wall St is general in nature. We provide commentary based on historical data and analyst forecasts only using an unbiased methodology and our articles are not intended to be financial advice. It does not constitute a recommendation to buy or sell any stock, and does not take account of your objectives, or your financial situation. We aim to bring you long-term focused analysis driven by fundamental data. Note that our analysis may not factor in the latest price-sensitive company announcements or qualitative material. Simply Wall St has no position in any stocks mentioned.
Have feedback on this article? Concerned about the content? Get in touch with us directly. Alternatively, email editorial-team@simplywallst.com