
Hubbell (HUBB) Dropped, So What Is Driving Attention Now?
Hubbell (HUBB) drew fresh attention after its recent share performance, with the stock down about 13% over the past month and roughly 12% over the past 3 months from its last close near $442.
Those short term declines come after a period of much stronger gains, with Hubbell delivering a 1 year total shareholder return of 2.21%, around 44% total shareholder return over 3 years, and about 160% over 5 years. This points to fading momentum rather than a broken long term story.
Scan beyond Hubbell and see how other grid and electrical infrastructure players with strong financials compare using our hand picked 38 power grid technology and infrastructure stocks
For Hubbell, the recent pullback can read as either sentiment cooling after a strong multi year run or a sharper signal about expectations. At today’s price, which story does the valuation tell?
Most Popular Narrative: 22% Undervalued
Against Hubbell's last close near $442, the most followed narrative framework points to a fair value of about $566, implying meaningful upside before the shares would line up with those assumptions.
Continued investment in acquisitions and focus on market-leading positions in utility and electrical markets, underpinned by secular growth trends, are expected to sustain long-term revenue growth and EPS expansion.
Find out how 16 investors see Hubbell as 22% undervalued.
Result: Fair Value of $566.30 (UNDERVALUED)
Still, that story only holds if Hubbell offsets higher raw material and tariff costs, and avoids a deeper demand slowdown that drags on grid and automation orders.
Find out about the key risks to this Hubbell narrative.
Another View On Hubbell’s Valuation
There is a different signal coming from the SWS DCF model. On that framework, Hubbell at about $442 a share screens as overvalued versus an estimated future cash flow value of roughly $375.90. This raises a simple question for investors: Is the market paying up for growth that cash flows do not fully support yet?
Look into how the SWS DCF model arrives at its fair value.
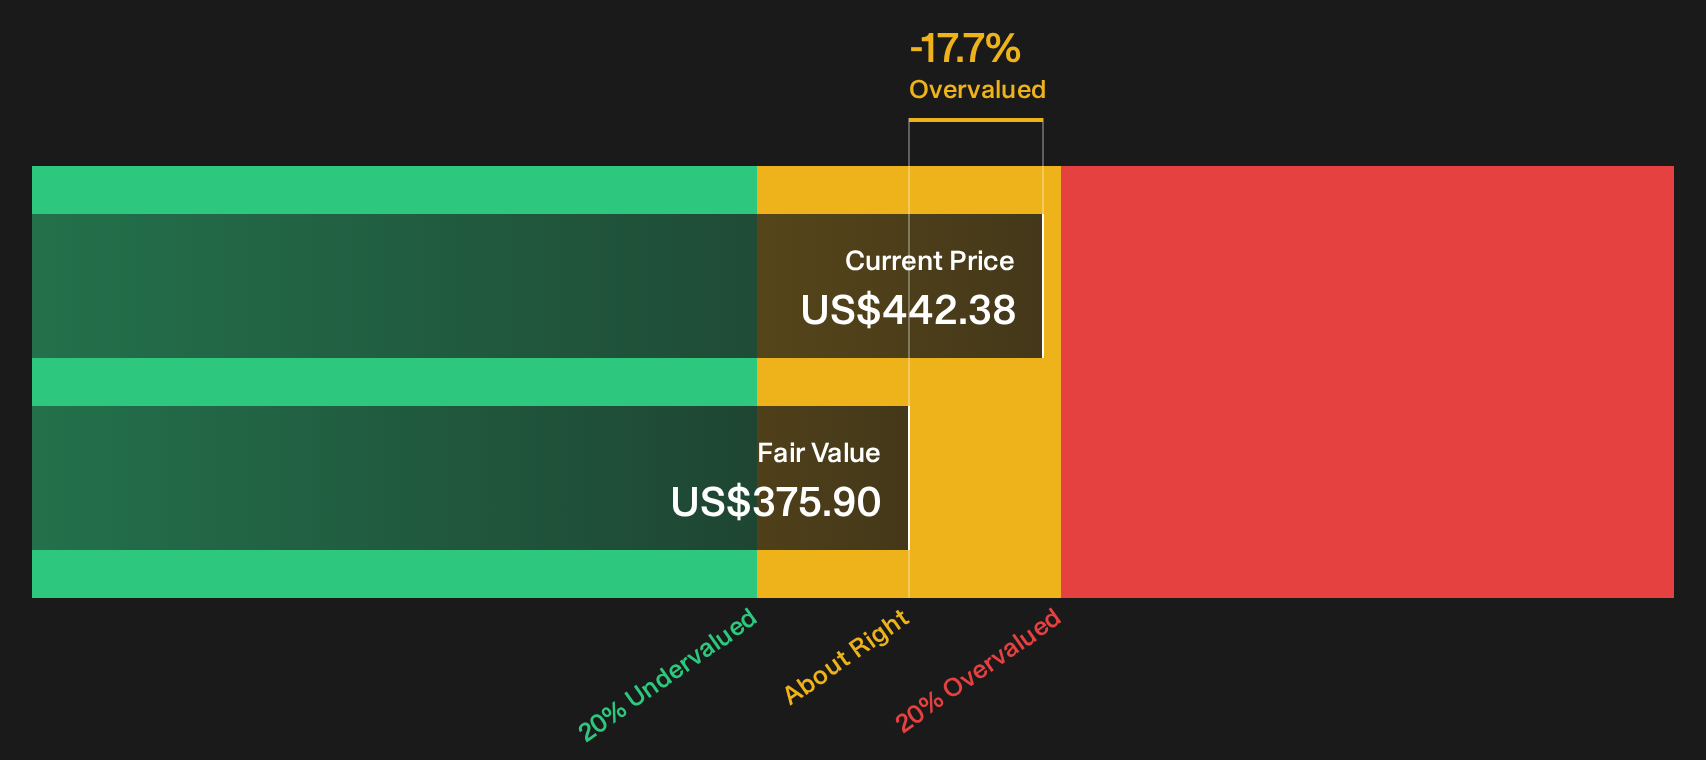
Simply Wall St performs a discounted cash flow (DCF) on every stock in the world every day (check out Hubbell for example). We show the entire calculation in full. You can track the result in your watchlist or portfolio and be alerted when this changes, or use our stock screener to discover 35 high quality undervalued stocks. If you save a screener we even alert you when new companies match - so you never miss a potential opportunity.
Next Steps
Mixed messages around Hubbell's value story can be hard to balance, so move quickly and weigh the upside against the downside by checking the 4 key rewards and 1 important warning sign.
Looking for more Hubbell sized investment ideas?
If Hubbell has you thinking more critically about value and risk, do not stop here. Broaden your watchlist now or you may miss better aligned opportunities.
- Target quality at a discount by scanning companies that combine strong fundamentals with appealing pricing using our focused 35 high quality undervalued stocks.
- Strengthen your income stream by hunting for companies with higher yields and resilient payouts through the dedicated 6 dividend fortresses.
- Protect your downside by filtering for resilient businesses with healthier financial profiles using the purpose built 11 resilient stocks with low risk scores.
This article by Simply Wall St is general in nature. We provide commentary based on historical data and analyst forecasts only using an unbiased methodology and our articles are not intended to be financial advice. It does not constitute a recommendation to buy or sell any stock, and does not take account of your objectives, or your financial situation. We aim to bring you long-term focused analysis driven by fundamental data. Note that our analysis may not factor in the latest price-sensitive company announcements or qualitative material. Simply Wall St has no position in any stocks mentioned.
Have feedback on this article? Concerned about the content? Get in touch with us directly. Alternatively, email editorial-team@simplywallst.com