
Shanghai Fudan Microelectronics Group (SEHK:1385) Slides As Valuation Questions Build, Is A 50% Discount Real?
Recent Share Performance and Business Context
Recent trading in Shanghai Fudan Microelectronics Group (SEHK:1385) has drawn attention as the stock has declined 3.1% over the past day and is down 9.1% over the past week.
The pullback extends through the past month and past 3 months, with the share price falling 9.8% and 14.8% respectively, while the year to date performance shows a decline of 49.1%. Over a longer horizon the total return over the past year is down 36.2%, although the 3-year total return is 46.3% and the 5-year figure is 16.7%.
Against this share price performance, Shanghai Fudan Microelectronics Group reports annual revenue of CN¥4,368.9m and net income of CN¥887.9m, with annual revenue growth of 14.9% and net income growth of 11.3%. The group focuses on integrated circuit design and related services across security and identification products, smart meter chips, NVM products and various analog circuits, with operations in Mainland China and internationally.
For investors watching Shanghai Fudan Microelectronics Group, the picture is one of pressure in the near term and earlier gains holding in the background, with recent share price weakness contrasting with positive 3 year and 5 year total shareholder returns.
The recent slide in the share price to HK$24.06, together with the year to date share price return of down 49.1%, suggests momentum has been fading as investors reassess how much risk they are willing to take on the stock despite its revenue and net income growth. This shift in sentiment often reflects changing expectations around future cash flows, the durability of profitability, or competitive pressure, even when the latest reported figures remain positive.
Scan how Shanghai Fudan Microelectronics Group compares with other chip designers facing similar sentiment swings by reviewing the hand picked 618 high quality undiscovered gems in this space.
Bulls point to Shanghai Fudan Microelectronics Group’s revenue and net income growth. Bears point to the steep share price slide. Which side does the current valuation evidence support?
Price-to-Earnings of 19.1x: Is it justified?
On the numbers, Shanghai Fudan Microelectronics Group trades on a P/E of 19.1x, which looks low next to both its peers and recent share price pressure. For anyone watching HK$24.06 as the last close, that multiple signals the market is not paying a high headline price for each unit of earnings.
The P/E ratio compares what investors pay per share with the company’s earnings per share. For a chip designer like Shanghai Fudan Microelectronics Group, this is often used as a quick yardstick for how much growth and profitability investors are willing to pay for relative to alternatives in the same sector.
Here, the P/E of 19.1x is described as good value versus similar stocks and the broader Asian Semiconductor group. It also sits below an estimated fair P/E of 25.2x that the SWS model suggests the stock could trade toward if the market priced earnings more in line with historical relationships. Taken together, the current discount hints that the market is pricing Shanghai Fudan Microelectronics Group’s earnings more cautiously than both its peer group and this fair ratio would imply.
The comparison is stark. The same framework shows Shanghai Fudan Microelectronics Group’s 19.1x P/E against a peer average of 31x and an Asian Semiconductor industry average of 33.9x. That is a wide gap and points to a market that is assigning a noticeably lower earnings multiple than it does for similar businesses in the region.
Explore the SWS fair ratio for Shanghai Fudan Microelectronics Group.
Result: Price-to-Earnings of 19.1x (UNDERVALUED)
Still, the Shanghai Fudan Microelectronics Group story can change quickly if chip demand softens further or if competitive pricing pressure reduces current profitability.
Find out about the key risks to this Shanghai Fudan Microelectronics Group narrative.
Another View on Shanghai Fudan Microelectronics Group’s Value
The P/E gap hints at value, but the SWS DCF model goes further. At HK$24.06, Shanghai Fudan Microelectronics Group is estimated to trade about 50% below an inferred fair value of HK$48.56, which points to a much wider margin. Which signal do you trust more: the earnings multiple or the cash flow math?
Look into how the SWS DCF model arrives at its fair value.
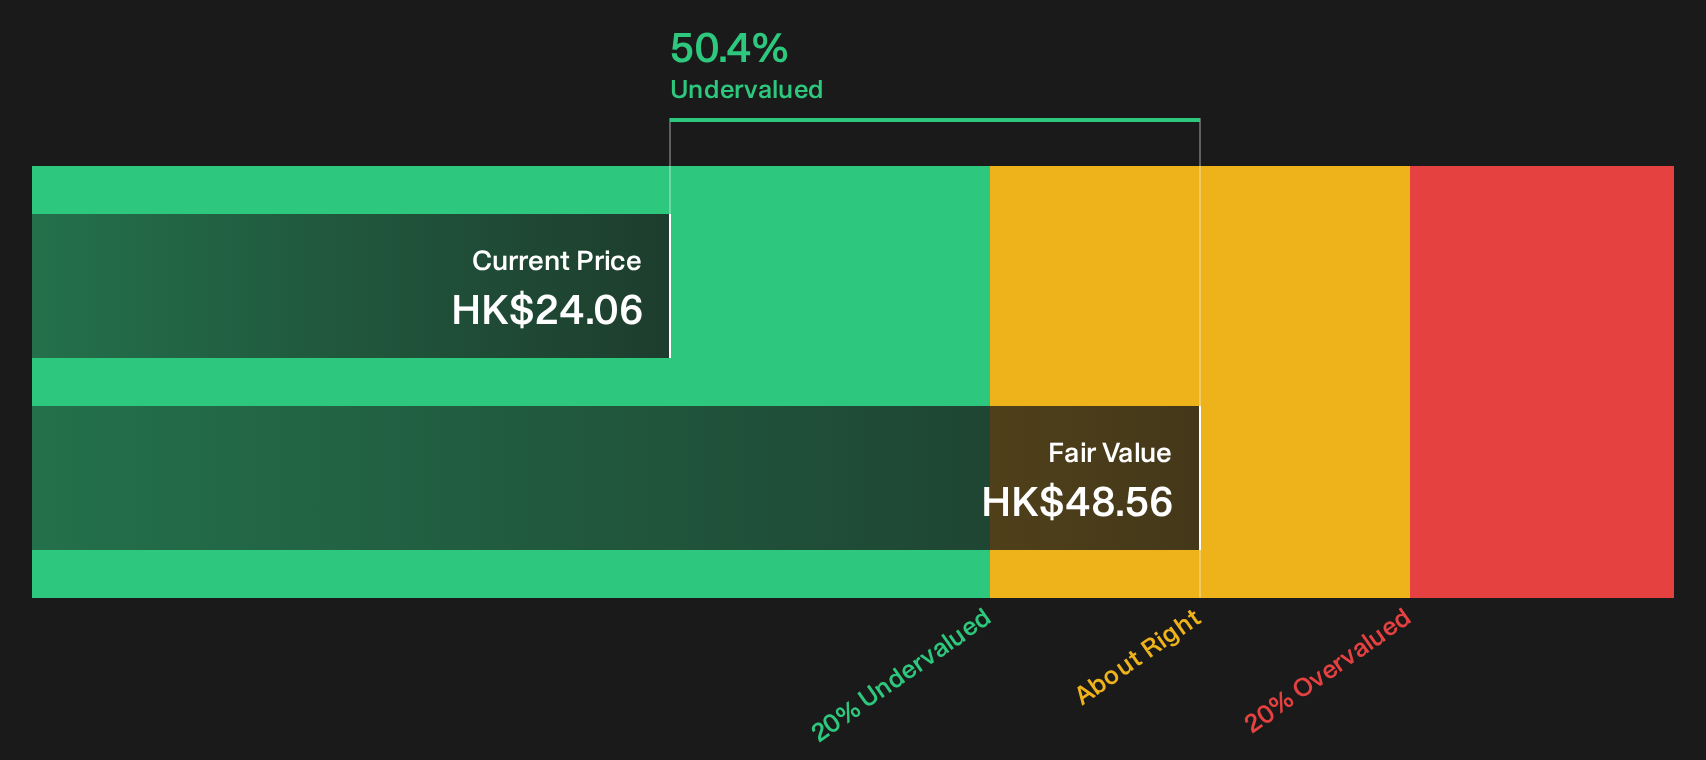
Simply Wall St performs a discounted cash flow (DCF) on every stock in the world every day (check out Shanghai Fudan Microelectronics Group for example). We show the entire calculation in full. You can track the result in your watchlist or portfolio and be alerted when this changes, or use our stock screener to discover 190 high quality undervalued stocks. If you save a screener we even alert you when new companies match - so you never miss a potential opportunity.
Next Steps
Mixed about the tone of Shanghai Fudan Microelectronics Group’s story so far and whether the risk reward trade off suits you? Move quickly, interrogate the numbers directly, and weigh the 4 key rewards and 1 important warning sign.
Looking for more investment ideas beyond Shanghai Fudan Microelectronics Group?
If Shanghai Fudan Microelectronics Group has sharpened your focus on valuation and risk, do not stop here. Use the Simply Wall Street Screener to uncover fresh opportunities that fit your style.
- Target potential bargains that combine quality with pricing support by reviewing the 190 high quality undervalued stocks.
- Prioritize resilience and capital protection by scanning the 103 resilient stocks with low risk scores, which may better align with your downside comfort level.
- Hunt for stronger balance sheets and sturdier fundamentals by checking the list of solid balance sheet and fundamentals (194 results) before the market prices them more fully.
This article by Simply Wall St is general in nature. We provide commentary based on historical data and analyst forecasts only using an unbiased methodology and our articles are not intended to be financial advice. It does not constitute a recommendation to buy or sell any stock, and does not take account of your objectives, or your financial situation. We aim to bring you long-term focused analysis driven by fundamental data. Note that our analysis may not factor in the latest price-sensitive company announcements or qualitative material. Simply Wall St has no position in any stocks mentioned.
Have feedback on this article? Concerned about the content? Get in touch with us directly. Alternatively, email editorial-team@simplywallst.com