
Is MillerKnoll (MLKN) Still Undervalued After A 40% Five Year Fall?
MillerKnoll stock has delivered a loss of almost 40% over the past five years, yet both an intrinsic value estimate and earnings multiple checks currently point to a cheaper profile than the market price suggests. That split between a weak long term return record and models flagging possible undervaluation is what matters for anyone trying to value the shares today.
- Over the past five years, MillerKnoll shareholders are down about 39.6%, which puts a spotlight on whether the recent share price properly reflects the business today.
- The key upside driver is the company’s ability to keep converting design demand into steady cash flow. A major risk is that any pressure on office and contract furniture spending could weigh on margins and delay that cash generation.
- The broader checks show a mixed picture rather than a clear bargain or clear overvaluation, with the company scoring 4 out of 6 on value tests.
The issue now is whether MillerKnoll’s current price leaves enough room between market value and intrinsic value estimates to compensate you for the business risks involved.
Compare MillerKnoll’s mixed 5 year record with a curated set of beaten down but potentially mispriced ideas by scanning 31 high quality undervalued stocks, which also screen well on quality and valuation checks.
Does MillerKnoll Look Undervalued on Cash Flow?
The Discounted Cash Flow model used here takes MillerKnoll’s expected future free cash generation and converts it into today’s dollars. Based on the latest twelve-month figures, the group produced around $93.6 million of free cash flow, and the projections assume this amount continues growing rather than shrinking over the coming decade.
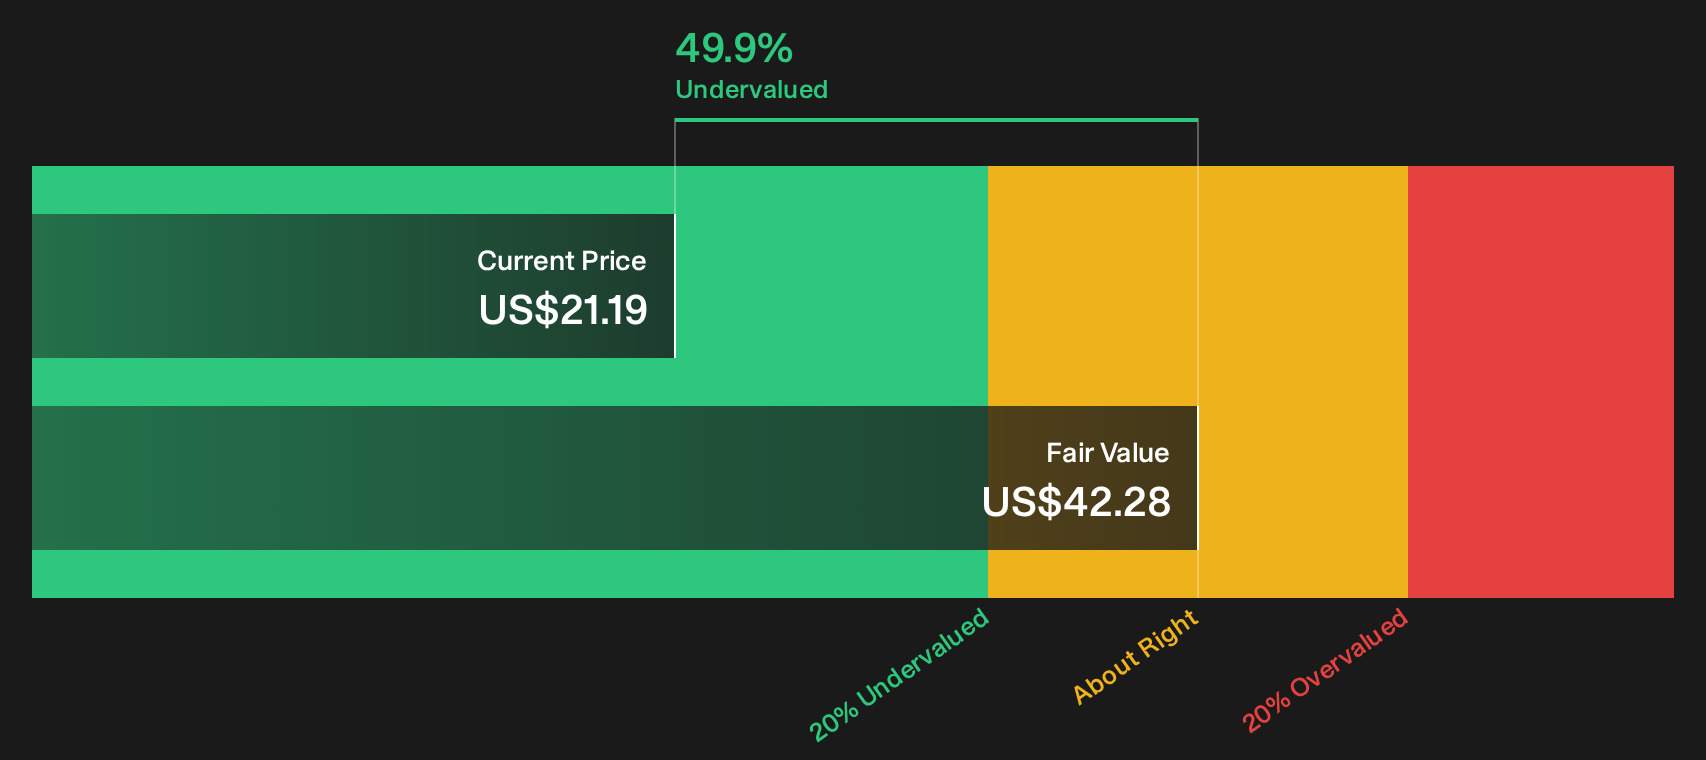
Under those assumptions, the DCF suggests an estimated intrinsic value of about $42 per share. Compared with the current market price, that indicates the stock trades at roughly a 49.9% discount, so MillerKnoll appears materially undervalued if these cash flow forecasts prove realistic.
On the DCF numbers alone, MillerKnoll appears undervalued relative to what its projected cash flows suggest the shares could be worth.
Our Discounted Cash Flow (DCF) analysis suggests MillerKnoll is undervalued by 49.9%. Track this in your watchlist or portfolio, or discover 31 more high quality undervalued stocks.
Does MillerKnoll Look Undervalued on Earnings?
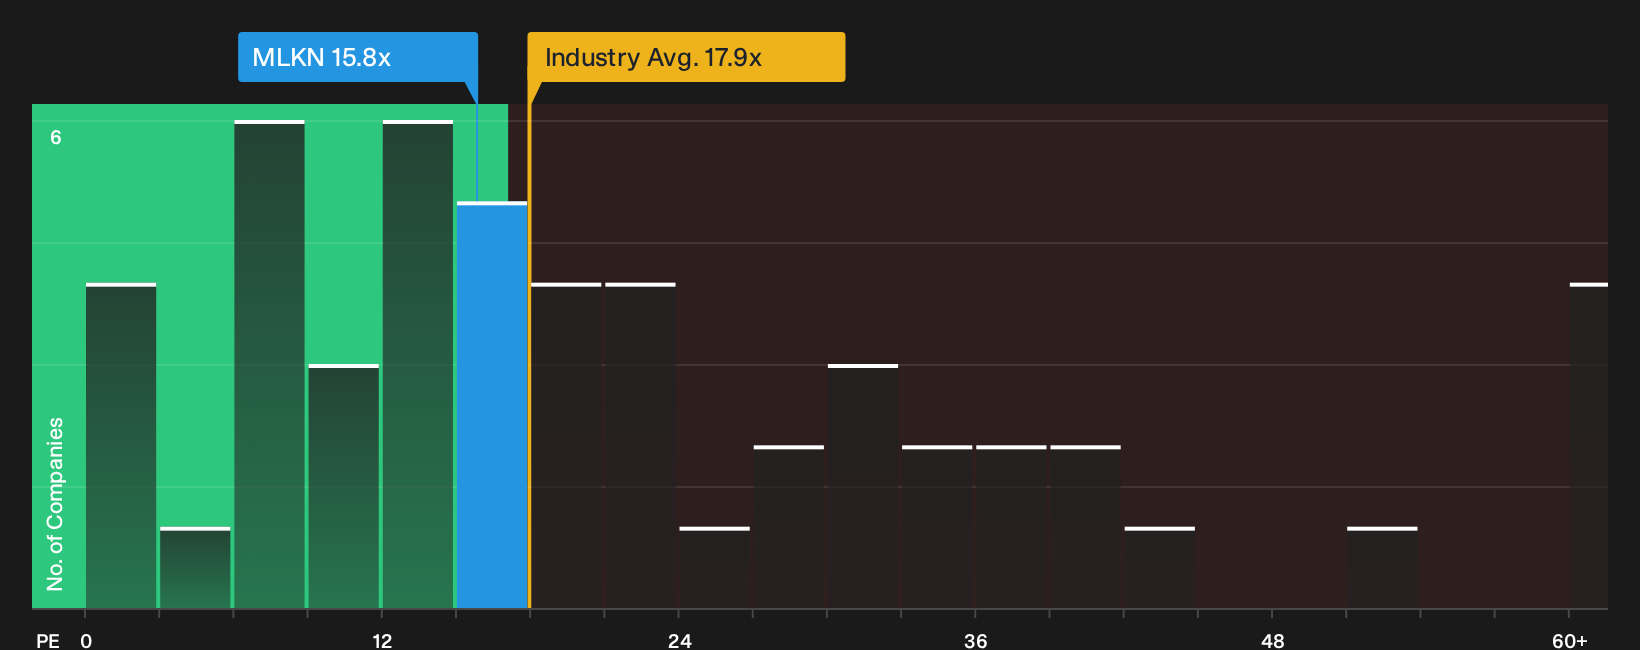
P/E is a useful cross check for MillerKnoll because earnings remain a key reference point for how this furniture group is being priced today. The stock trades on a P/E of about 15.8x, compared with an industry average of roughly 17.9x and a peer group around 13.2x. That already puts the shares below the broader commercial services pack, while not looking stretched against closer competitors.
The model driven fair P/E for MillerKnoll is around 23.1x, based on its mix of growth assumptions, profitability profile and risk inputs. Set against the current 15.8x multiple, the gap is wide. This indicates that the market price is assigning a lower earnings value than this framework suggests. If the business can support those earnings levels over time, that discount may be significant.
On the P/E test, MillerKnoll stock appears undervalued compared with the earnings multiple implied by its fair ratio.
See what the numbers say about this price — find out in our valuation breakdown.
The MillerKnoll Narrative: What Would Justify Today's Price?
Narratives for MillerKnoll pick up where the valuation puzzle leaves off and spell out which specific paths for growth, margins and earnings would need to play out for the stock to be worth materially more or less than today’s price. Each scenario ties its numbers to a clear view on where MillerKnoll’s prospects and risks might head next, giving you a structure you can revisit as fresh information comes through.
You can add your voice to the MillerKnoll story by publishing a Narrative that lays out a number driven view on where its growth, margins and execution go from here. Set out your thesis, track how it holds up as fresh results arrive, and see how it stacks up against other investors in the Simply Wall St community.
Do you think there's more to the story for MillerKnoll? Head over to our Community to see what others are saying!
The Bottom Line
MillerKnoll screens as undervalued on both the Discounted Cash Flow (DCF) intrinsic value estimate and the earnings multiple checks, which point in the same direction even though the broader valuation score is only mixed. The gap between market price and those models only becomes meaningful if the group can keep translating design demand into reliable free cash flow while holding margins against any pressure on office and contract furniture budgets. That is the crux for investors weighing MillerKnoll today, whether the current discount compensates for the risk that end market spending stays soft and the cash generation story takes longer to play out.
This article by Simply Wall St is general in nature. We provide commentary based on historical data and analyst forecasts only using an unbiased methodology and our articles are not intended to be financial advice. It does not constitute a recommendation to buy or sell any stock, and does not take account of your objectives, or your financial situation. We aim to bring you long-term focused analysis driven by fundamental data. Note that our analysis may not factor in the latest price-sensitive company announcements or qualitative material. Simply Wall St has no position in any stocks mentioned.
Have feedback on this article? Concerned about the content? Get in touch with us directly. Alternatively, email editorial-team@simplywallst.com