
Burning Rock Biotech (BNR) Stock Rallies While Losses Still Deepen
Burning Rock Biotech rose 5.7% today, extending a sharp three-month rally, even though the latest quarter still shows the business firmly in loss-making territory. Traders are reacting to improving top-line scale rather than clean profitability. Revenue for Q2 was ¥134.8m, while the company reported a net loss of ¥18.4m and a basic loss per share of ¥1.70. For anyone looking beyond the next few sessions, the focus is on whether that growing sales base, together with a P/S of 1.8x against far richer biotech peers, can eventually support a path out of red ink.
Love the revenue momentum at Burning Rock Biotech but worried about backing a loss-making stock? Filter for peers that combine growth with stronger fundamentals using our list of solid balance sheet and fundamentals stocks (23 results).
Q2 2026 Earnings Summary
- Revenue (Q2 2026 vs. Q2 2025): ¥134.8m vs. ¥148.6m (lower year on year)
- Net Loss (Q2 2026 vs. Q2 2025): ¥18.4m loss vs. ¥9.7m loss (loss widened)
- Basic EPS (Q2 2026 vs. Q2 2025): loss of ¥1.70 per share vs. loss of ¥0.90 per share (per share loss increased)
- Trailing 12-month Net Loss (Q2 2026 TTM vs. Q2 2025 TTM): ¥68.0m loss vs. ¥140.2m loss (loss reduced on a rolling 12-month basis)
Prefer clean charts instead of pages of raw figures and footnotes? See Burning Rock Biotech’s full financial picture in a visual format that highlights valuation and key drivers in our company report for Burning Rock Biotech.
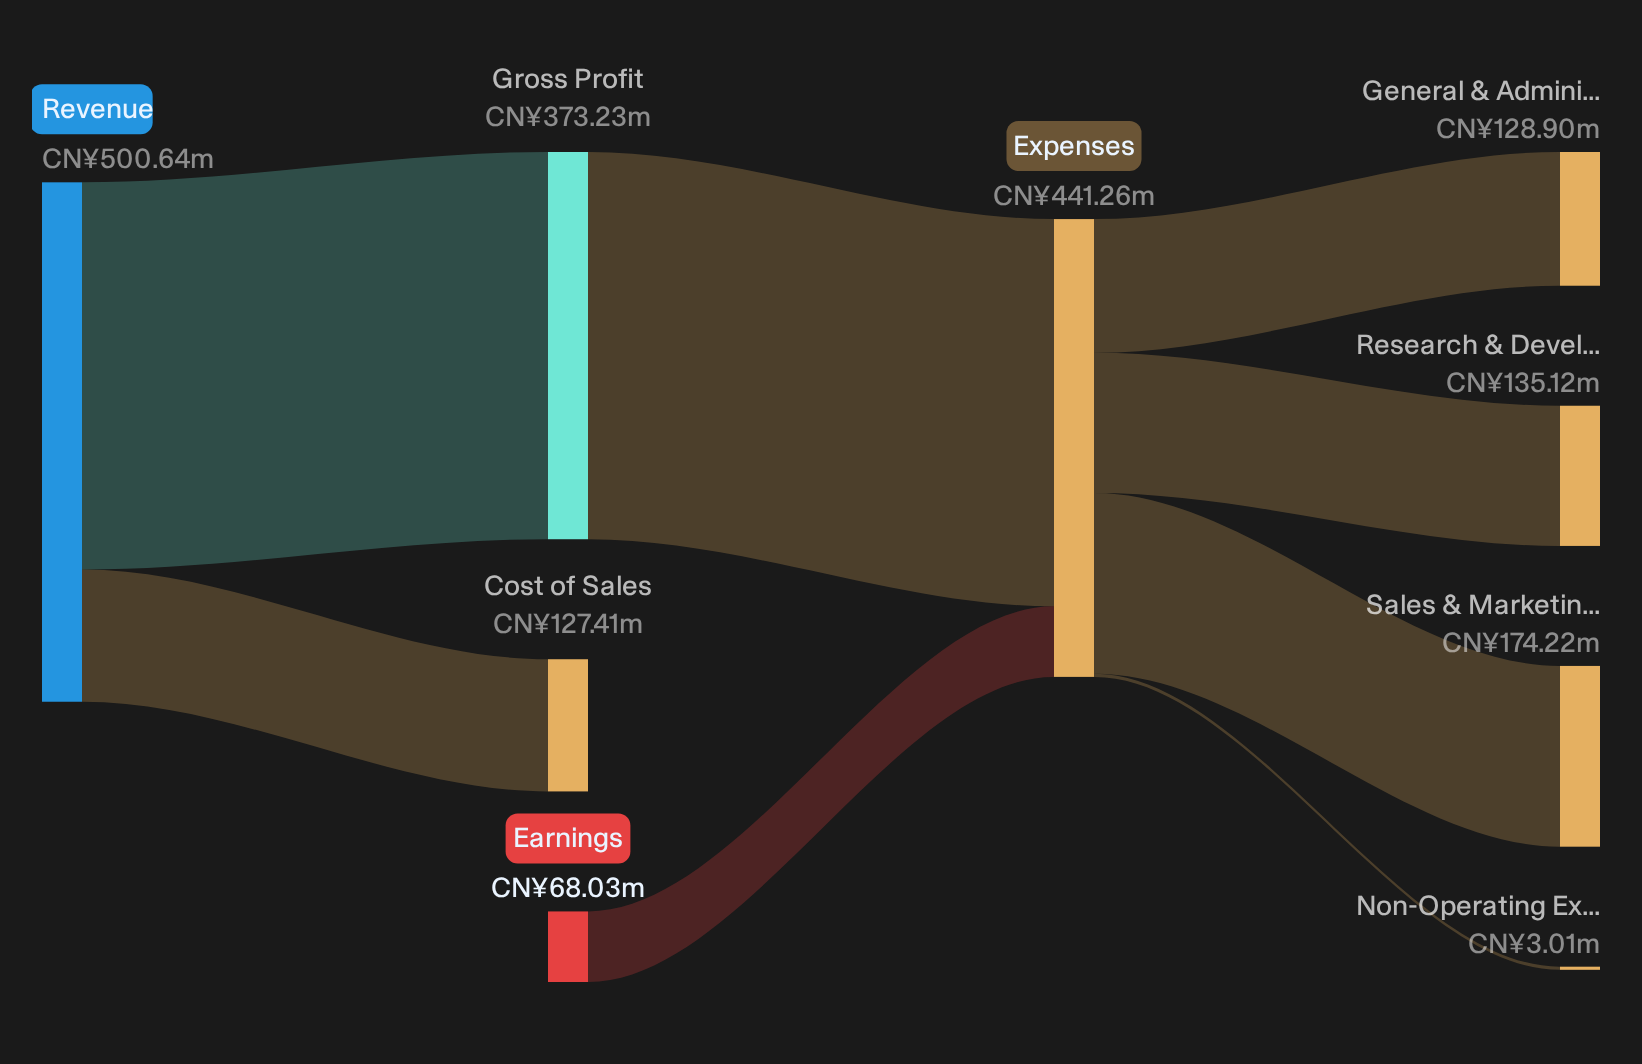
Burning Rock Biotech: Testing The Bullish Story
For anyone leaning bullish on Burning Rock Biotech, the clearest help is on the loss trend. The trailing 12 month loss narrowed to ¥68.0m compared with ¥140.2m a year earlier. That points to better cost discipline or improved mix, even though quarterly revenue of ¥134.8m sits below last year’s ¥148.6m. The share price move, up 5.7% today and higher over 30 and 90 days, suggests investors are giving some credit for that progress toward smaller aggregate losses despite a softer single quarter.
Bear Signals: Revenue Dip And Deeper Quarterly Loss
The bear side still has real ammunition. Q2 revenue of ¥134.8m is below the prior year’s ¥148.6m, which undercuts the earlier growth tone around Burning Rock Biotech. The quarterly loss also widened to ¥18.4m from ¥9.7m, and basic loss per share moved further into the red at ¥1.70 from ¥0.90. That combination tells you the path to profitability is not linear. Even with a better trailing 12 month loss profile, the most recent quarter shows the business can still move backward on both scale and earnings.
After a quarter in which revenue slipped and losses deepened, it is fair to ask whether this is simply execution noise or a sign of deeper structural issues. Review our independent risk analysis for Burning Rock Biotech which shows 1 important warning signGuide Your Next Move With Simply Wall St
With Burning Rock Biotech still working through losses and mixed quarterly trends, it can help to register for free with Simply Wall St and add it to a Watchlist so you can track price against fair value and wait for a setup that fits your plan. Once you decide to buy or sell, use the Portfolio Command Center to cut through noise and focus on the updates that actually matter to your holdings. For longer term conviction, tap into the Community to see how other investors are thinking through the same data and risks. That way you can identify potential catalysts and red flags early and give yourself more opportunity to stay a step ahead of the wider market.
Seeking Fresh Alternatives Beyond Burning Rock Biotech
Fresh breakout stories rarely stay under the radar for long. Prices move, sentiment flips, and the cleanest entries get caught by early movers. Scan these ideas before the momentum starts flying and act now.
- Scan for cash generative growth stories that pair strong balance sheets with real earnings power using the curated 74 profitable AI stocks that aren't just burning cash.
- Spot potential breakout compounders that already show resilient risk profiles by reviewing the hand picked 11 resilient stocks with low risk scores.
- Hunt for future leaders with founder skin in the game and long term focus inside the carefully filtered 19 top founder-led companies.
This article by Simply Wall St is general in nature. We provide commentary based on historical data and analyst forecasts only using an unbiased methodology and our articles are not intended to be financial advice. It does not constitute a recommendation to buy or sell any stock, and does not take account of your objectives, or your financial situation. We aim to bring you long-term focused analysis driven by fundamental data. Note that our analysis may not factor in the latest price-sensitive company announcements or qualitative material. Simply Wall St has no position in any stocks mentioned.
Have feedback on this article? Concerned about the content? Get in touch with us directly. Alternatively, email editorial-team@simplywallst.com