
Is Headwater Exploration (TSX:HWX) Still Cheap After The Tamarack Valley Energy Deal?
Headwater Exploration (TSX:HWX) moved into the spotlight after Tamarack Valley Energy agreed to acquire the producer in an all-stock deal valued at about CA$3.2b, with investors set to receive Tamarack shares.
Headwater Exploration shares now trade at CA$13.51. While the 1-day and 7-day share price returns have slipped 1.82% and 4.99% as the Tamarack deal terms settle in, the year-to-date share price return of 41.61% and 1-year total shareholder return of 95.33% point to momentum that has built over a longer stretch.
Scan 35 elite gold producer stocks if the Headwater Exploration deal has you looking for other resource producers that could be preparing for their next significant move.
Headwater Exploration now trades on a rich recent track record and an agreed all stock tie up with Tamarack. Does that mix still tilt the risk reward toward new buyers, once valuation is stripped back and compared to fundamentals?
Price-to-Earnings of 17.3x: Is it justified for Headwater Exploration?
Headwater Exploration trades on a P/E of 17.3x, which screens as cheaper than both peer averages and the wider Canadian oil and gas group at the current CA$13.51 share price.
The P/E ratio compares the current share price with earnings per share. For a producer like Headwater Exploration, this metric gives a quick read on how much the market is paying for each dollar of profit. A lower P/E than similar businesses can hint that investors are assigning a discount to future earnings, or that the share price has not fully matched the company’s profit record.
Here, the 17.3x multiple sits below the peer average of 21.6x and also under the Canadian oil and gas industry average of 21.1x. That gap suggests the stock is priced more conservatively than many competitors, despite earnings that have grown 17.9% per year over five years and are judged to be high quality. Combined with the separate SWS DCF view that Headwater Exploration at CA$13.51 trades below an estimated future cash flow value of CA$28.86, the current earnings multiple indicates the market is applying a relatively cautious tag to the business.
See what the numbers say about this price — find out in our valuation breakdown.
Result: Price-to-Earnings of 17.3x (UNDERVALUED)
Still, the all stock Tamarack deal and full exposure to Canadian crude pricing leave Headwater Exploration vulnerable if terms shift or commodity conditions weaken.
Find out about the key risks to this Headwater Exploration narrative.
Another View on Headwater Exploration's value
The P/E points to a cautious price tag for Headwater Exploration at CA$13.51, yet the SWS DCF model comes in far more optimistic. On that approach, the estimated future cash flow value sits at CA$28.86, which screens as undervalued if those assumptions hold up.
These are two different lenses that provide very different signals. Which one do you lean on when real money is on the line: earnings today, or projected cash flows tomorrow?
Look into how the SWS DCF model arrives at its fair value.
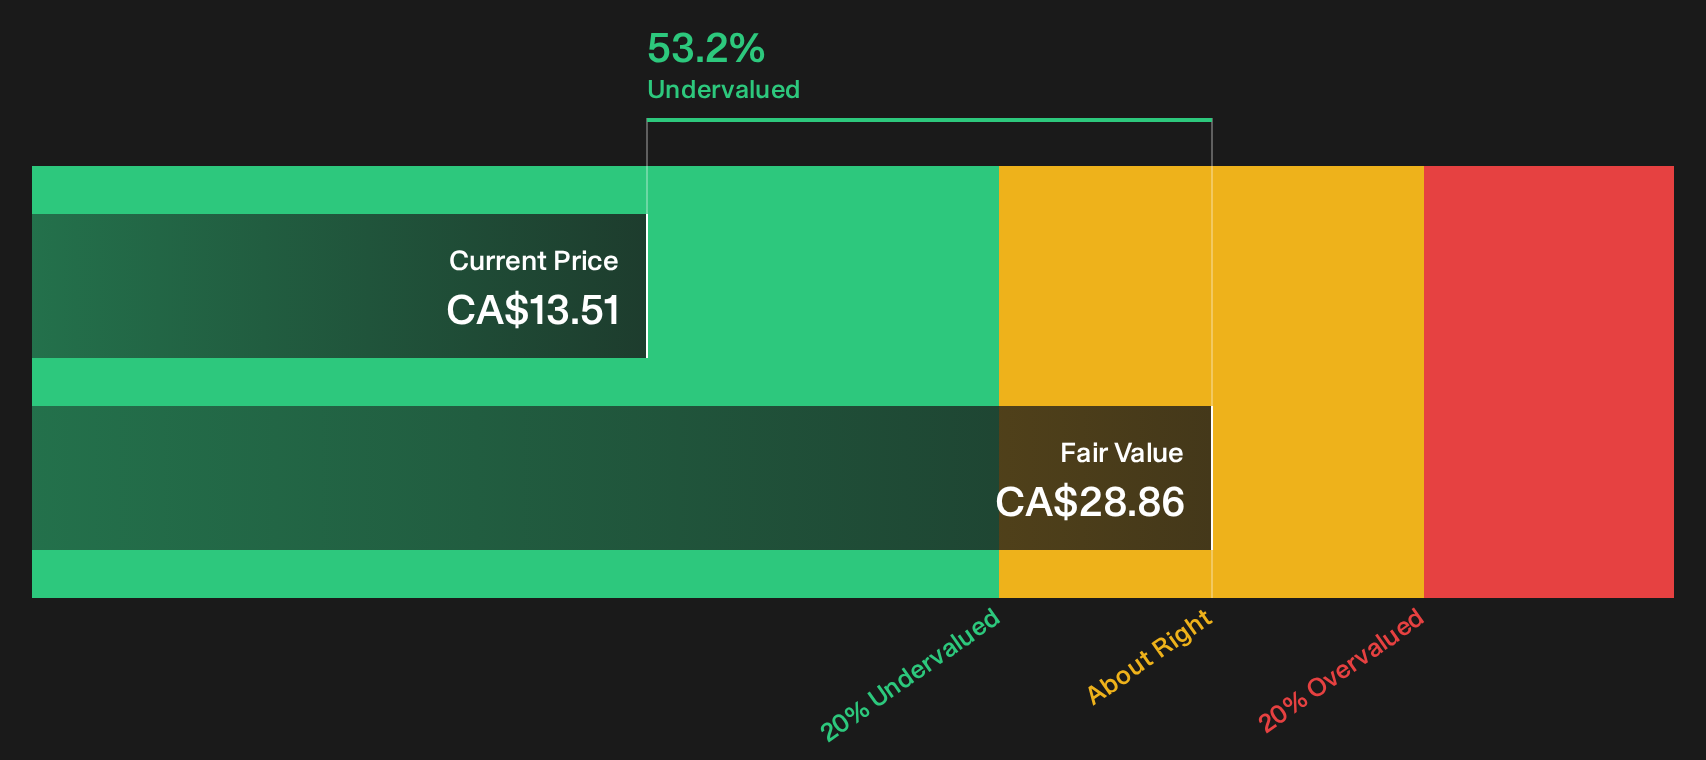
Simply Wall St performs a discounted cash flow (DCF) on every stock in the world every day (check out Headwater Exploration for example). We show the entire calculation in full. You can track the result in your watchlist or portfolio and be alerted when this changes, or use our stock screener to discover 5 high quality undervalued stocks. If you save a screener we even alert you when new companies match - so you never miss a potential opportunity.
Next Steps
Headwater Exploration now carries a mixed story, with both concerns and positives on the table. It makes sense to review the data yourself while sentiment is still settling and then weigh up the 3 key rewards and 1 important warning sign.
Looking for more Headwater Exploration sized investment ideas?
If the Headwater Exploration story has sharpened your focus on value and quality, do not stop here. Use the Simply Wall Street Screener to spot other opportunities before they move.
- Target resilient performers that aim to balance potential and stability by scanning the 1 resilient stocks with low risk scores.
- Hunt for quality businesses that trade at what could be a discount to their fundamentals by checking the 9 high quality undiscovered gems.
- Focus on companies where strong finances back up the share price by filtering through the list of solid balance sheet and fundamentals (7 results).
This article by Simply Wall St is general in nature. We provide commentary based on historical data and analyst forecasts only using an unbiased methodology and our articles are not intended to be financial advice. It does not constitute a recommendation to buy or sell any stock, and does not take account of your objectives, or your financial situation. We aim to bring you long-term focused analysis driven by fundamental data. Note that our analysis may not factor in the latest price-sensitive company announcements or qualitative material. Simply Wall St has no position in any stocks mentioned.
Have feedback on this article? Concerned about the content? Get in touch with us directly. Alternatively, email editorial-team@simplywallst.com