
Is Keppel DC REIT (SGX:AJBU) Still Reasonable At Current Prices?
Keppel DC REIT is trading against a quietly constructive backdrop, with a solid 3 year return profile and both intrinsic value estimates and market multiples pointing to a stock that screens as cheaper than its fundamentals suggest.
- Over the past 3 years, Keppel DC REIT has delivered a total return of about 14.8%, which signals that longer term holders have still come out ahead despite recent softness.
- The business model is closely tied to recurring data centre rental income, which can support valuation if cash flows remain steady. At the same time, any sustained pressure on asset values or funding costs may weigh on what investors are prepared to pay.
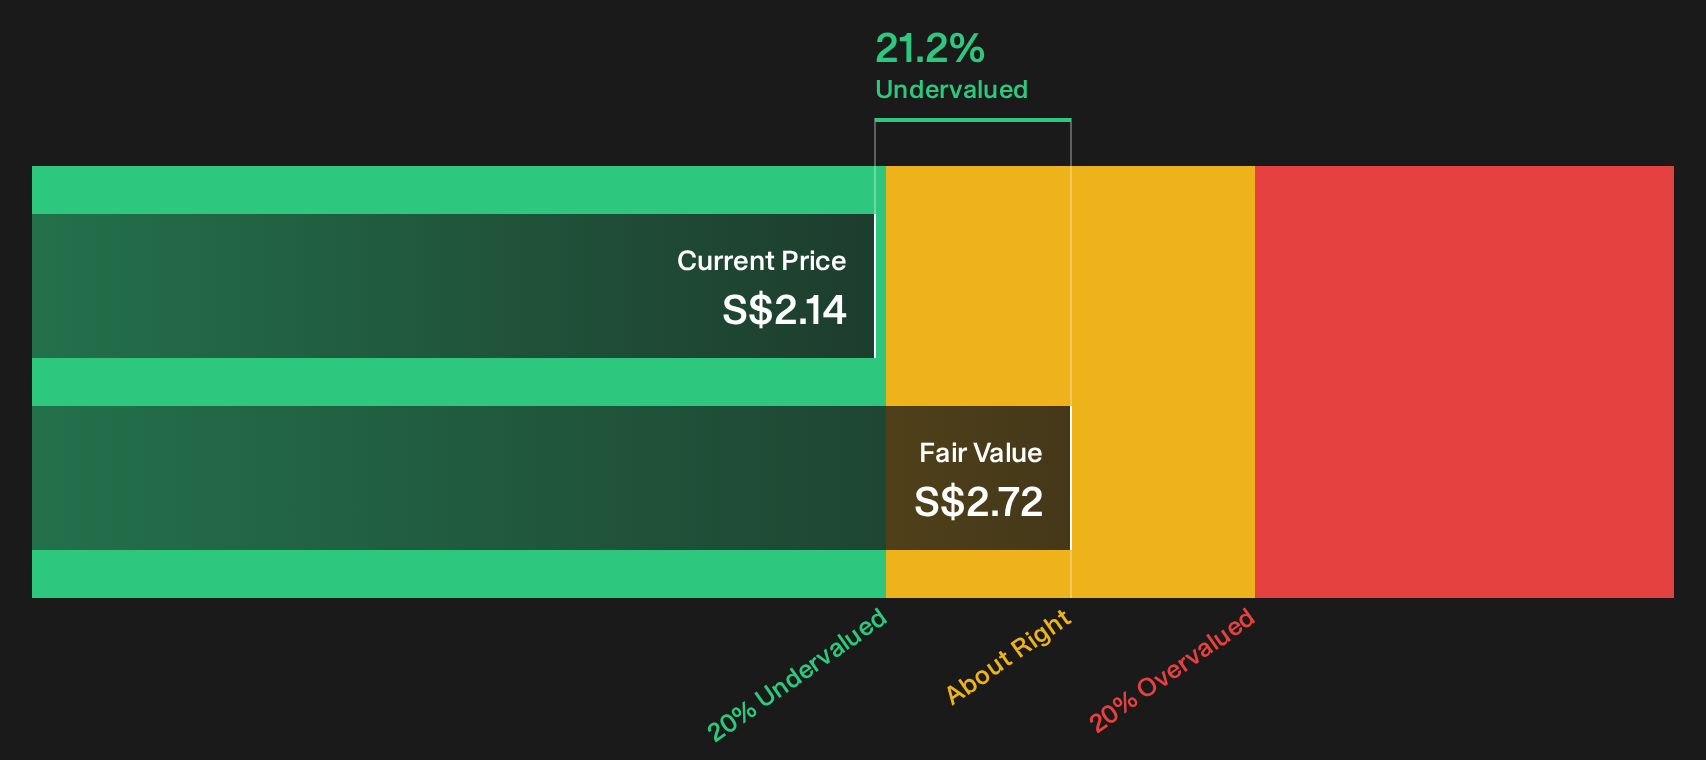
- The broader valuation checks lean cheap, with the stock screening as undervalued across multiple methods. This includes an intrinsic value estimate from a Discounted Cash Flow (DCF) approach that sits about 21.2% above the current price.
The issue now is whether Keppel DC REIT's current unit price already reflects these supportive signals, or if the gap to the intrinsic value estimate still offers meaningful upside for new capital.
Scan beyond Keppel DC REIT and line up other potential value ideas that screen as both attractively priced and fundamentally supported with 183 high quality undervalued stocks
Is Keppel DC REIT Still Cheap on Cash Flow?
The Discounted Cash Flow (DCF) model here is built off adjusted funds from operations to capture how much cash Keppel DC REIT can realistically return to unitholders over time. Recent projections point to future annual free cash flows in the hundreds of Millions of SGD, with a path that assumes steady rather than explosive growth.
On those assumptions, the DCF framework points to an intrinsic value of about SGD2.72 per unit. Compared with the current market price, that implies the units trade at roughly a 21.2% discount to this cash flow based estimate. For readers, the key takeaway is that the DCF outcome lines up with the broader message from earnings multiples, which both suggest Keppel DC REIT screens on the cheaper side relative to its underlying cash generation.
On balance, the DCF workup indicates Keppel DC REIT appears undervalued relative to the cash flows implied by current forecasts.
Our Discounted Cash Flow (DCF) analysis suggests Keppel DC REIT is undervalued by 21.2%. Track this in your watchlist or portfolio, or discover 183 more high quality undervalued stocks.
Is Keppel DC REIT a Bargain on Earnings?
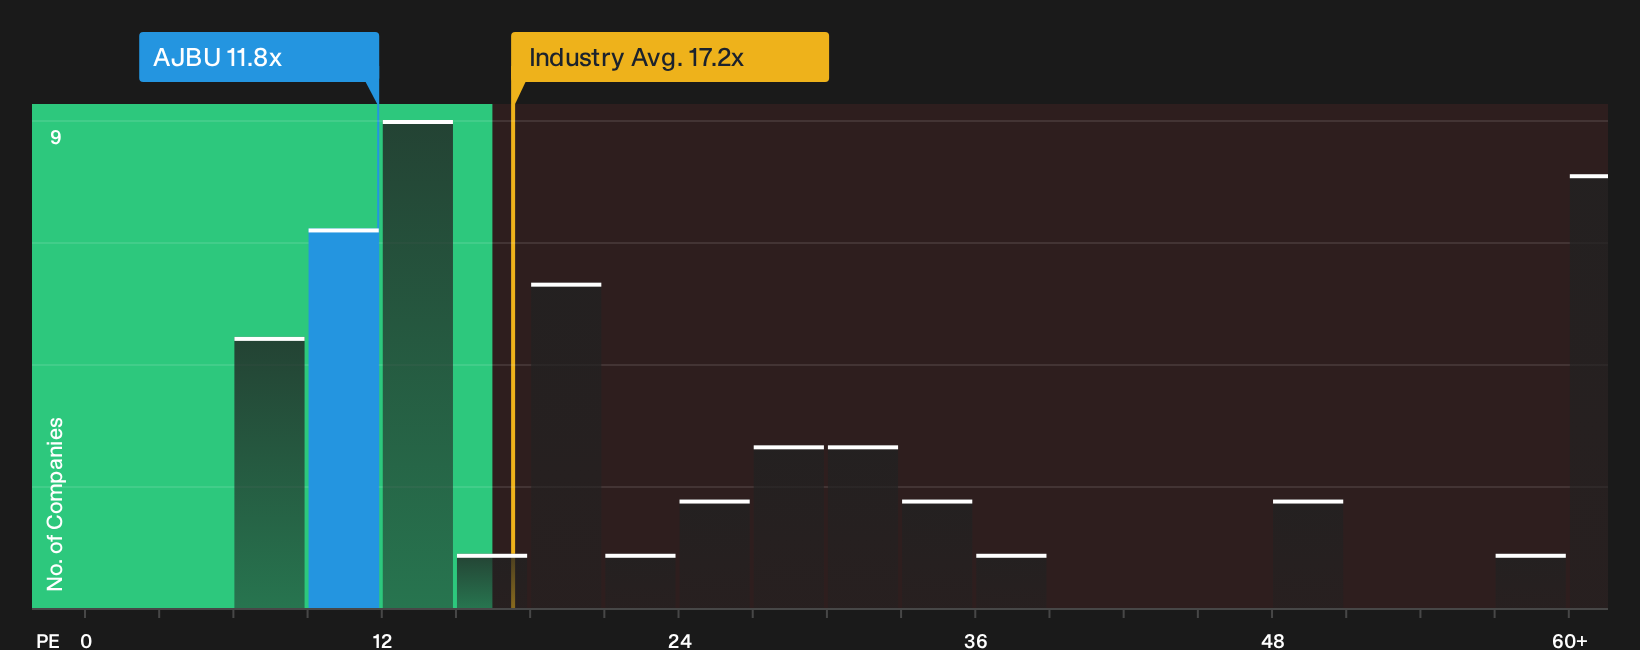
P/E suits Keppel DC REIT because earnings are a key yardstick for how much unitholders are paying for each dollar of profit. On this measure, the trust trades on about 11.8x earnings, compared with roughly 17.2x for the wider Specialized REITs group and around 15.9x for peers. That places the units at a clear discount to both the sector and similar stocks on a straight earnings basis.
A more tailored fair P/E ratio for Keppel DC REIT, which blends in factors like size, risk profile and sector, is about 14.6x. Compared with the current 11.8x, this indicates the units trade below the level that this framework implies investors might typically pay for these earnings. For readers comparing valuation tools, this earnings-based signal aligns with the earlier cash flow analysis.
On the P/E multiple, Keppel DC REIT appears undervalued relative to both its sector and the fair ratio implied by its fundamentals.
See what the numbers say about this price — find out in our valuation breakdown.
The Keppel DC REIT Narrative: What Would Justify Today's Price?
Simply Wall St Narratives for Keppel DC REIT pick up where the valuation work leaves off by explaining what kind of growth, margins and earnings path would need to hold for the units to be worth materially more or less than today’s price on the Community page. Each narrative links a specific set of potential catalysts and risks to its own fair value view, so you can track over time which version of Keppel DC REIT's story is actually unfolding.
You can add your voice to the Keppel DC REIT story by publishing a Narrative that sets out a clear, number driven view on where its growth, margins and execution go from here. Put your thesis on record in the Simply Wall St community and track how it stacks up as new results land.
Do you think there's more to the story for Keppel DC REIT? Head over to our Community to see what others are saying!
The Bottom Line
Keppel DC REIT screens as undervalued on both the Discounted Cash Flow (DCF) work and the P/E comparison, which point in the same direction rather than giving mixed signals. The gap between intrinsic value estimates and current trading levels only matters if cash flows and balance sheet costs hold roughly in line with the assumptions already on the table. What really separates optimists from sceptics is whether the current discount reflects temporary caution around funding and asset values, or a lasting reset in what investors are willing to pay for data centre exposure.
This article by Simply Wall St is general in nature. We provide commentary based on historical data and analyst forecasts only using an unbiased methodology and our articles are not intended to be financial advice. It does not constitute a recommendation to buy or sell any stock, and does not take account of your objectives, or your financial situation. We aim to bring you long-term focused analysis driven by fundamental data. Note that our analysis may not factor in the latest price-sensitive company announcements or qualitative material. Simply Wall St has no position in any stocks mentioned.
Have feedback on this article? Concerned about the content? Get in touch with us directly. Alternatively, email editorial-team@simplywallst.com