
Empire (TSX:EMP.A) Declares Its Dividend, Is The Stock Fully Priced?
Empire (TSX:EMP.A) is back on income investors' radar after its board declared a quarterly dividend of $0.2425 per share, with payment scheduled for October 30, 2026, to eligible shareholders.
Empire’s dividend update lands after a softer stretch for the shares, with the 30-day share price return down 7.52% and the year-to-date share price return lower by 5.33% at a recent CA$45.61. However, the 3-year total shareholder return of 31.74% still reflects a stronger longer-run outcome.
Spot 2 dividend fortresses that, like Empire, pair income potential with established cash generation in sectors where payouts are a central part of the investment story.Empire shares have slipped even as the dividend and recent earnings headlines stay firm. For an income holder eyeing a grocery heavyweight, does that recent pullback already offer fair value or is patience wiser?
Price-to-Earnings of 46.6x: Is it justified?
On a headline measure, Empire screens as expensive, with a P/E of 46.6x against a recent share price of CA$45.61 and weaker near term share returns.
The P/E ratio compares what investors currently pay for each dollar of earnings. For a mature food retailer like Empire, a higher multiple usually implies that the market is pricing in steadier profitability or a cleaner earnings profile than the latest numbers suggest.
That narrative runs into some friction. Earnings have fallen by 68.9% over the past year, net profit margins slipped from 2.2% to 0.7%, and management has highlighted a large one off loss of CA$705.0m weighing on the last 12 months. At the same time, the dividend yield of 2.13% is flagged as not well covered by earnings, which leaves less room for comfort if profits stay under pressure.
The premium really stands out once you look across the aisle. Empire’s P/E of 46.6x is materially higher than the Canadian consumer retailing peer average of 26.8x and even further above the broader North American consumer retailing group at 19x. That gap suggests investors are paying a sizeable surcharge for Empire relative to comparable retailers, even as the 1 year total return has lagged both the Canadian consumer retailing industry, which returned 6.7%, and the wider Canadian market at 21.7%.
See what the numbers say about this price — find out in our valuation breakdown.
Result: Price-to-Earnings of 46.6x (OVERVALUED)
Still, the recent share price drift and a dividend flagged as not well covered by earnings could pressure Empire if profitability remains under strain.
Find out about the key risks to this Empire narrative.
Another View on Empire’s Value
The P/E looks demanding, yet our DCF model presents an even stronger perspective on Empire’s current pricing. On that framework, the share price of CA$45.61 sits above an estimated future cash flow value of CA$32.34. For anyone weighing income against capital risk, that gap is hard to overlook.
Look into how the SWS DCF model arrives at its fair value.
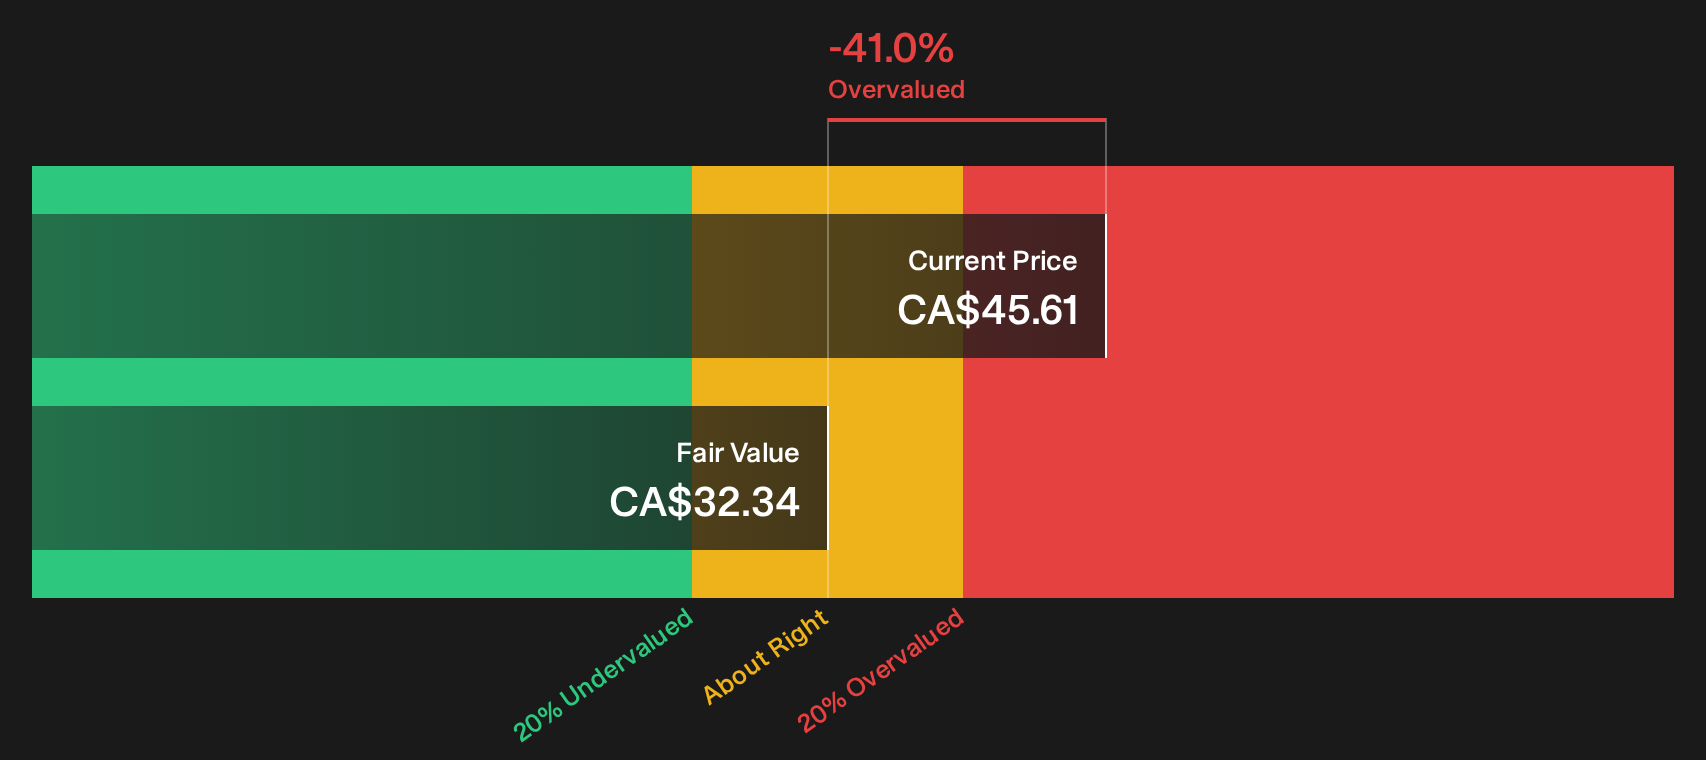
Simply Wall St performs a discounted cash flow (DCF) on every stock in the world every day (check out Empire for example). We show the entire calculation in full. You can track the result in your watchlist or portfolio and be alerted when this changes, or use our stock screener to discover 5 high quality undervalued stocks. If you save a screener we even alert you when new companies match - so you never miss a potential opportunity.
Next Steps
If the Empire story so far feels mixed, now is the moment to review the details yourself and weigh the trade off between income and risk. A good place to start is by checking 4 important warning signs.
Looking for more Empire style investment ideas?
Broaden your watchlist now and line up your next move before the crowd by using screeners that surface income, value, and resilience in a few focused clicks.
- Target dependable income streams by scanning for established payers that echo Empire’s dividend appeal through the 2 dividend fortresses.
- Hunt for quality at a sensible price by filtering financially robust businesses that look mispriced using the 5 high quality undervalued stocks.
- Prioritise resilience by zeroing in on companies with steadier balance sheets and fundamentals through the list of solid balance sheet and fundamentals (7 results).
This article by Simply Wall St is general in nature. We provide commentary based on historical data and analyst forecasts only using an unbiased methodology and our articles are not intended to be financial advice. It does not constitute a recommendation to buy or sell any stock, and does not take account of your objectives, or your financial situation. We aim to bring you long-term focused analysis driven by fundamental data. Note that our analysis may not factor in the latest price-sensitive company announcements or qualitative material. Simply Wall St has no position in any stocks mentioned.
Have feedback on this article? Concerned about the content? Get in touch with us directly. Alternatively, email editorial-team@simplywallst.com