
Is IRADIMED (IRMD) Overvalued After A 157% Five Year Run?
IRADIMED has delivered a strong 5 year share price run, yet its current valuation checks suggest the stock now trades at a premium to what its cash flow and market multiples imply.
- The share price is up about 156.7% over 5 years, which sets a high bar for any new investor looking for further gains from here.
- The business model, built around MRI compatible patient monitoring equipment, can support expectations for steady cash generation. However, any slowdown in unit demand or pricing could weigh heavily on those assumptions.
- The broader valuation checks lean expensive, with IRADIMED scoring 0 out of 6 on the value screen. This suggests it is not a clear bargain at current levels.
The issue now is whether IRADIMED's current share price leaves enough room between market price and intrinsic value to compensate you for the risks in its cash flow outlook.
Balance that rich 5 year IRADIMED run by comparing it with hand picked companies on the 31 high quality undervalued stocks, which screen for quality cash flows and more grounded valuations.
Has IRADIMED Run Too Far on Cash Flow?
The Discounted Cash Flow (DCF) model used here focuses on the cash IRADIMED can generate for shareholders over time. Latest twelve month free cash flow sits at about $20.0 million, with the projection path treated as growing rather than shrinking, and feeding into a 2 Stage Free Cash Flow to Equity framework.
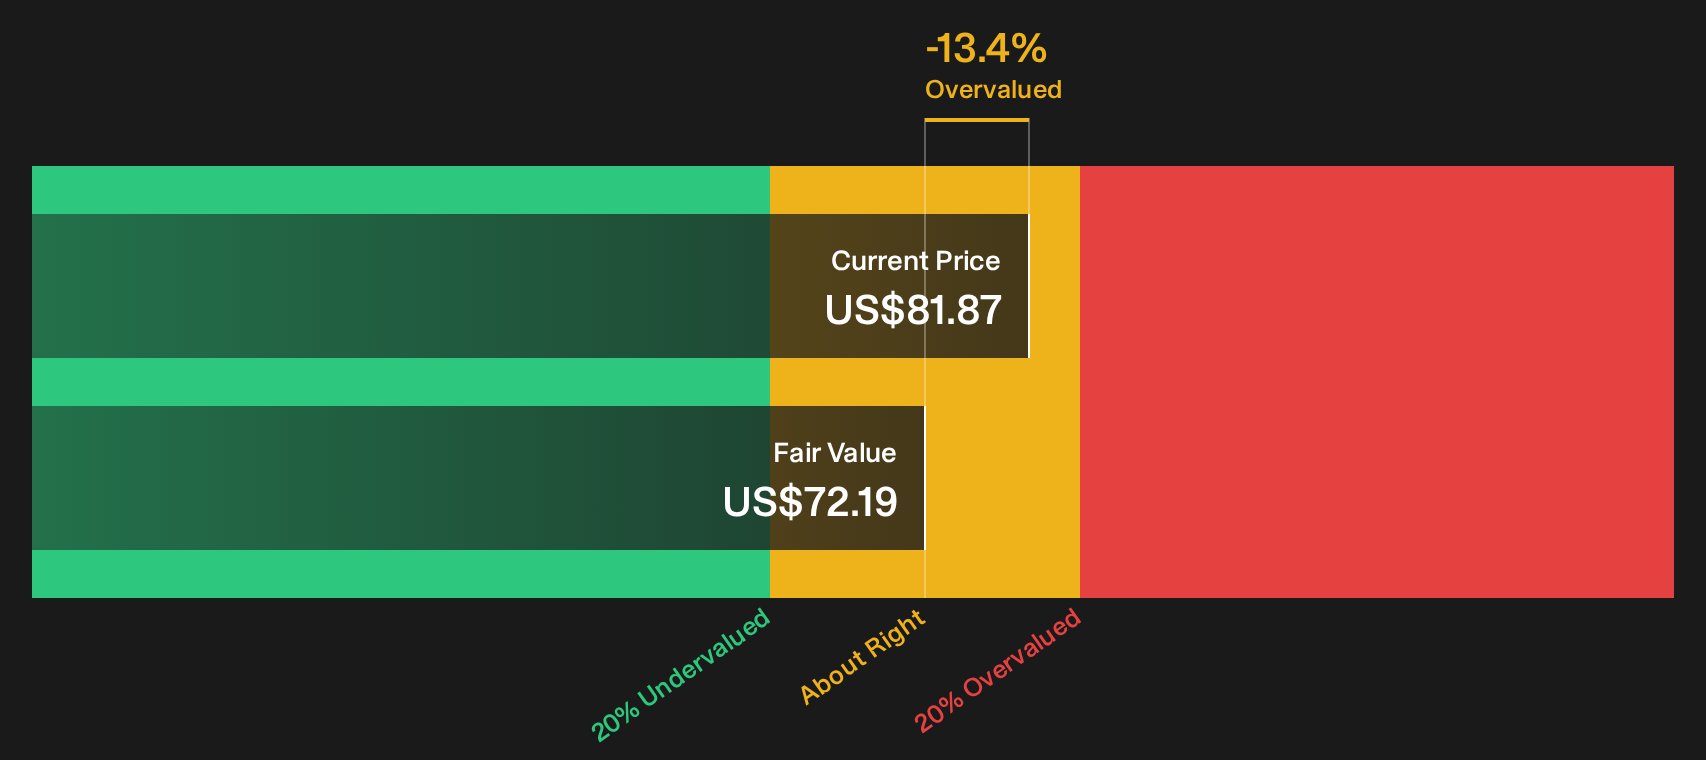
Based on these assumptions, the DCF points to an estimated intrinsic value of about $72 per share. This figure sits below the current market price, which implies the stock trades at roughly a 13.4% premium to the value suggested by its projected cash flows. In other words, the market price for IRADIMED is higher than the value supported by this cash generation model today.
On this Discounted Cash Flow view, IRADIMED currently screens as overvalued.
Our Discounted Cash Flow (DCF) analysis suggests IRADIMED may be overvalued by 13.4%. Discover 31 high quality undervalued stocks or create your own screener to find better value opportunities.
Has IRADIMED Run Too Far on Earnings?
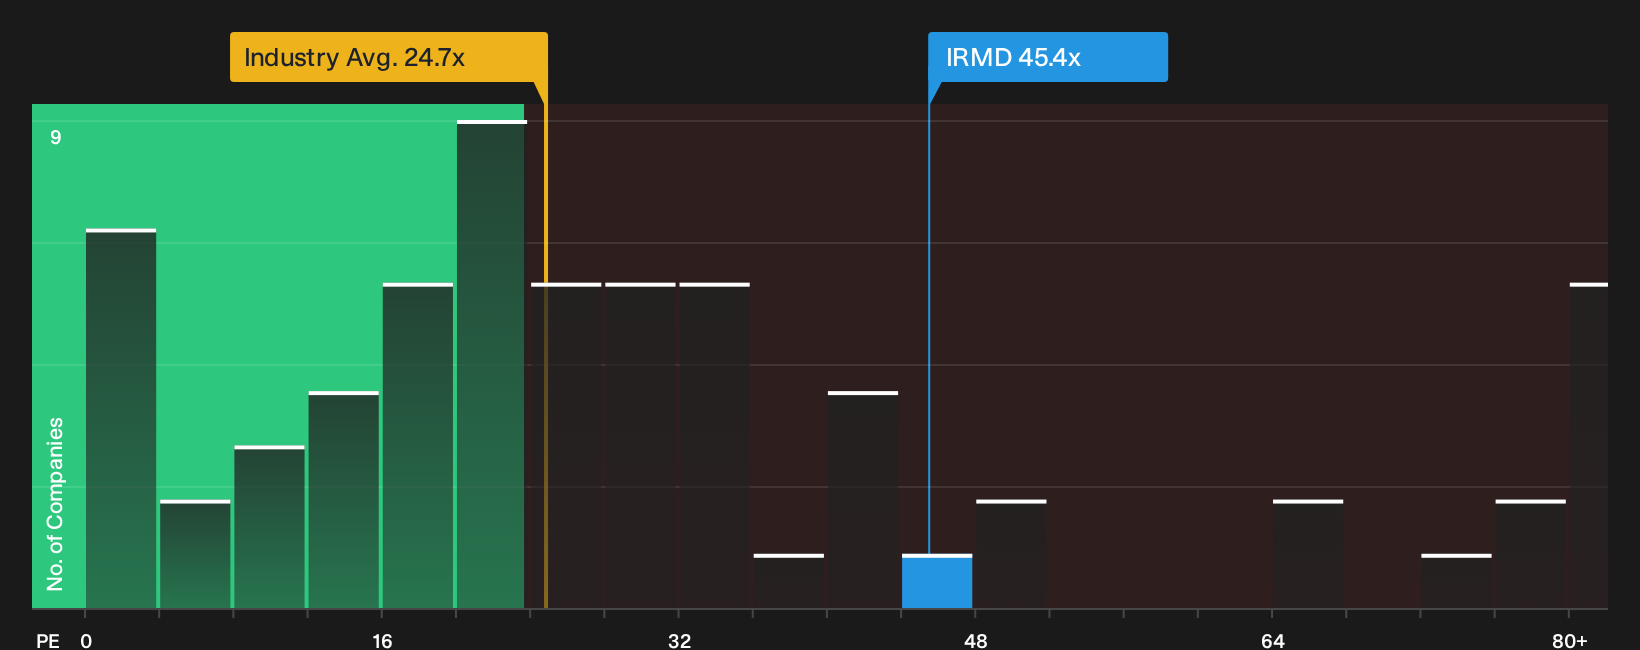
P/E is one way to size up IRADIMED because earnings influence what buyers are paying for each dollar of profit. On this measure, the stock trades on about 45.4x earnings. The wider Medical Equipment group sits closer to 24.7x and the peer set averages roughly 26.0x, so IRADIMED trades at a premium to both its sector and direct comparables.
The fair P/E ratio implied by the model is about 21.8x. This is less than half of where IRADIMED currently trades, which indicates a wide gap between what the earnings profile might justify and what the market is currently willing to pay. For anyone considering a position after a substantial share price move, this kind of multiple may leave less room for error if earnings growth or margins do not align with optimistic expectations.
On the P/E test, IRADIMED appears overvalued because investors are paying a much richer earnings multiple than the fair ratio suggests.
See what the numbers say about this price — find out in our valuation breakdown.
The IRADIMED Narrative: What Would Justify Today's Price?
Narratives for IRADIMED on Simply Wall St pick up where this valuation puzzle leaves off. They explain which paths for revenue growth, profitability and earnings would need to occur for the current share price to appear cheap or expensive. Each scenario links its figures to a specific view on how IRADIMED's growth, margins and risks could evolve, providing something concrete to revisit as new results and guidance are released.
Add your own narrative on IRADIMED's valuation and a view on where its growth, margins and execution go from here, and then monitor how your thesis compares as future results are reported. Share a number-driven case that other Simply Wall St readers can use to assess market movements.
Do you think there's more to the story for IRADIMED? Head over to our Community to see what others are saying!
The Bottom Line
IRADIMED screens as overvalued on both Discounted Cash Flow (DCF) and earnings-based metrics, which points to a lot of optimism already in the price. The richer P/E ratio and the intrinsic value estimate both assume the business can keep converting its MRI monitoring niche into consistent cash generation. What really separates bulls and bears now is confidence in that cash flow path. If unit demand, pricing and margins hold up, today’s premium may prove sustainable. However, any wobble in those drivers would leave far less protection for new capital going into IRADIMED at current levels.
This article by Simply Wall St is general in nature. We provide commentary based on historical data and analyst forecasts only using an unbiased methodology and our articles are not intended to be financial advice. It does not constitute a recommendation to buy or sell any stock, and does not take account of your objectives, or your financial situation. We aim to bring you long-term focused analysis driven by fundamental data. Note that our analysis may not factor in the latest price-sensitive company announcements or qualitative material. Simply Wall St has no position in any stocks mentioned.
Have feedback on this article? Concerned about the content? Get in touch with us directly. Alternatively, email editorial-team@simplywallst.com