
GMO Payment Gateway (TSE:3769) Faces A Valuation Test As Its Pullback Deepens
GMO Payment Gateway (TSE:3769) has drawn fresh attention after recent trading left the share price at ¥8,293, with the stock down over the past week and month but roughly flat across the past 3 months.
For context, GMO Payment Gateway’s share price has dropped 18.5% over the past month and 12.6% year to date. However, the 1 year total shareholder return of 2.0% suggests dividends and past price gains have partly cushioned recent losing momentum.
Compare GMO Payment Gateway’s recent pullback with other listed payment and fintech operators by scanning our hand picked 73 high quality undiscovered gems that pair solid fundamentals with less crowded sentiment.
GMO Payment Gateway still runs a sizeable payments platform with growing lines of business, yet the share price has retreated sharply. Do those fundamentals line up with what the market is charging today?
Price-to-Earnings of 25x: Is it justified for GMO Payment Gateway?
On simple valuation terms, GMO Payment Gateway looks expensive compared to the broader Japanese diversified financials peer group, yet cheaper than its closest high growth rivals. The stock trades on a P/E of about 25x, while the industry average sits at 14.2x and the peer group average is a much richer 38.4x.
The P/E ratio compares the current share price to earnings per share. For a payments and fintech operator like GMO Payment Gateway, this matters because investors often anchor expectations on how quickly profits can expand and how resilient those earnings might be through cycles.
GMO Payment Gateway has a few things working behind that 25x multiple. Earnings grew 25.8% over the past year, ahead of its own 5 year annualised profit growth of 12.1%. Net profit margins sit at 27.6%, higher than 24.9% a year earlier, and its current Return on Equity of 20.3% is described as high. Forecasts point to revenue growth of 14.8% per year and earnings growth of 16% per year, both above the wider JP market expectations.
The comparison with peers is where the valuation context sharpens. GMO Payment Gateway trades at a premium to the broader JP diversified financials sector on P/E terms, yet at a discount to its more growth focused peer set where the average P/E is 38.4x. That suggests the market is pricing in solid growth and profitability, but not to the same degree as the faster rated group, while still assigning a clear premium to the wider sector.
Result: Price-to-Earnings of 25x (ABOUT RIGHT)
Explore the SWS fair ratio for GMO Payment Gateway.
Still, the recent 5 year total shareholder return decline of 42.6% and the stock’s weak year to date move suggest that sentiment around GMO Payment Gateway can shift quickly.
Find out about the key risks to this GMO Payment Gateway narrative.
Another View on GMO Payment Gateway’s Value
The P/E ratio presents GMO Payment Gateway as slightly expensive relative to its own fair ratio, yet the SWS DCF model sends a different message. On that cash flow view, the shares at ¥8,293 sit about 20.7% below an estimated value of ¥10,454.64. This frames the recent pullback as a possible mismatch between price and long term cash generation.
Look into how the SWS DCF model arrives at its fair value.
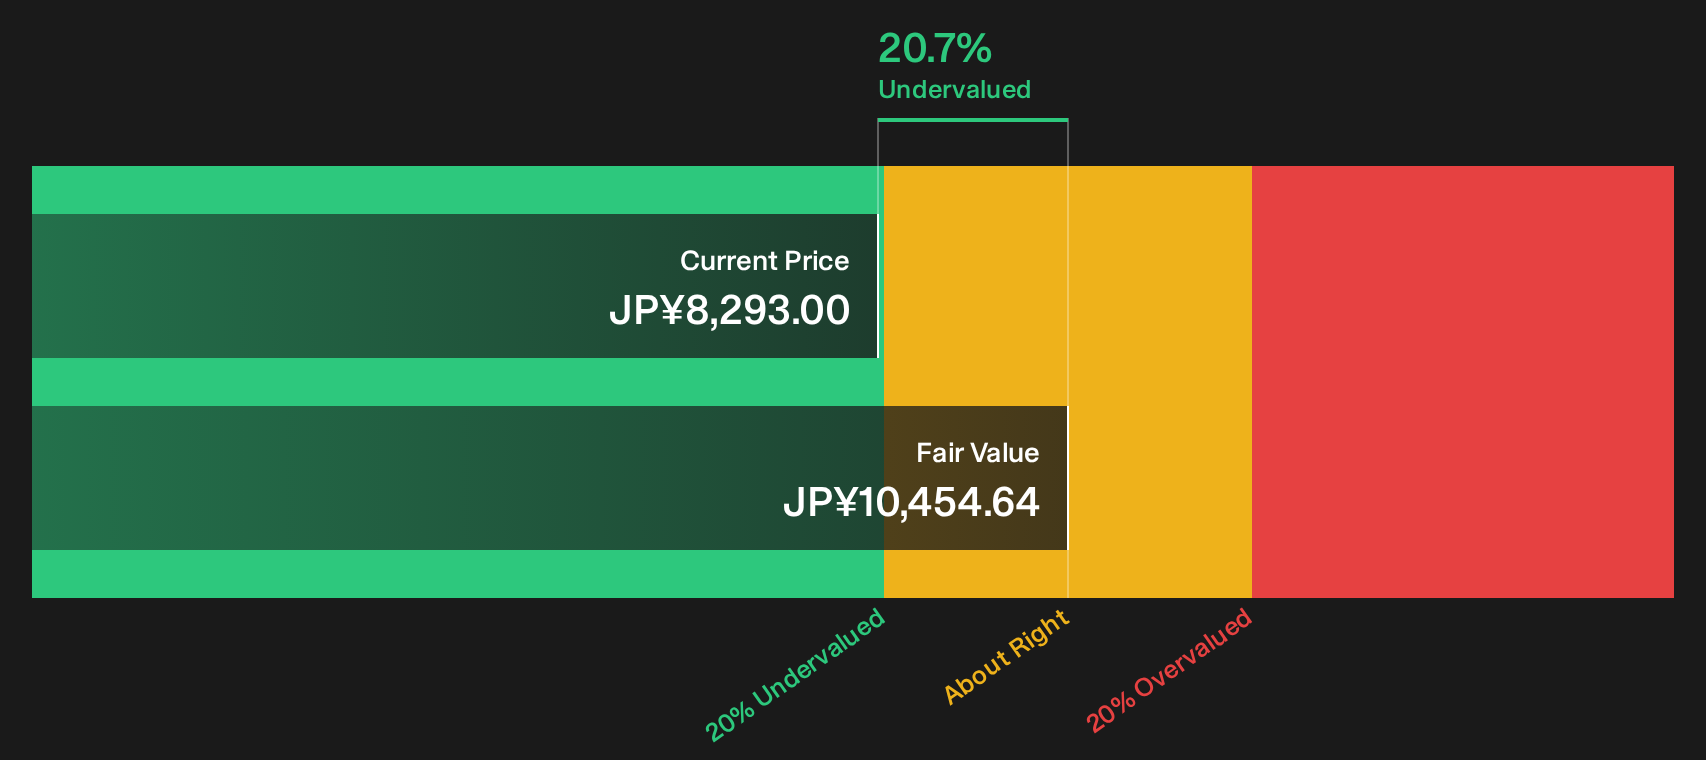
Simply Wall St performs a discounted cash flow (DCF) on every stock in the world every day (check out GMO Payment Gateway for example). We show the entire calculation in full. You can track the result in your watchlist or portfolio and be alerted when this changes, or use our stock screener to discover 16 high quality undervalued stocks. If you save a screener we even alert you when new companies match - so you never miss a potential opportunity.
Next Steps
Mixed signals around GMO Payment Gateway can feel confusing, so move quickly from headline moves to hard numbers and weigh both sides of the story for yourself by checking the 5 key rewards and 1 important warning sign.
Looking for more GMO Payment Gateway style investment ideas?
GMO Payment Gateway only tells part of the story. You can quickly widen your opportunity set by scanning targeted stock ideas that match different risk and return profiles.
- Target stronger upside potential by reviewing companies that screen as 16 high quality undervalued stocks before they attract broader attention.
- Secure more reliable income streams by focusing on businesses that appear as 19 dividend fortresses for consistent cash payouts.
- Dial down volatility by concentrating on financially robust businesses surfaced in our 10 resilient stocks with low risk scores.
This article by Simply Wall St is general in nature. We provide commentary based on historical data and analyst forecasts only using an unbiased methodology and our articles are not intended to be financial advice. It does not constitute a recommendation to buy or sell any stock, and does not take account of your objectives, or your financial situation. We aim to bring you long-term focused analysis driven by fundamental data. Note that our analysis may not factor in the latest price-sensitive company announcements or qualitative material. Simply Wall St has no position in any stocks mentioned.
Have feedback on this article? Concerned about the content? Get in touch with us directly. Alternatively, email editorial-team@simplywallst.com