
Lululemon (LULU) Stock May Sit Above Fair Value On Cash Flow But Below Fair Value On Earnings
lululemon athletica has seen its share price fall sharply over the past few years, while current valuation checks send mixed messages as the Discounted Cash Flow (DCF) intrinsic value estimate points to a premium and market multiples suggest the stock may instead be on the cheaper side. After this kind of reset, the question for you is whether the recent drop has already absorbed the bad news or if the quoted price still builds in too much optimism about the brand and its future cash flows.
- Over the past 5 years, lululemon athletica has delivered a total return that is down about 77%, which shows how much sentiment around the business and its prospects has reversed.
- Recent cuts to sales expectations and weaker store traffic can weigh on near term cash generation, while the ongoing brand work and product repositioning may support a recovery in revenue and profitability if execution improves.
- The broader valuation score is 3 out of 6, which points to a mixed picture rather than a clear bargain or clear overvaluation when looking across different checks.
The issue now is whether lululemon athletica's current share price already reflects these operational and brand challenges, or if the intrinsic value estimate and multiples still leave limited room for disappointment.
Spot check how lululemon athletica compares by scanning 33 high quality undervalued stocks. These pair solid balance sheets and positive cash generation with valuations that still look compressed after heavy share price resets.Has lululemon athletica Run Too Far on Cash Flow?
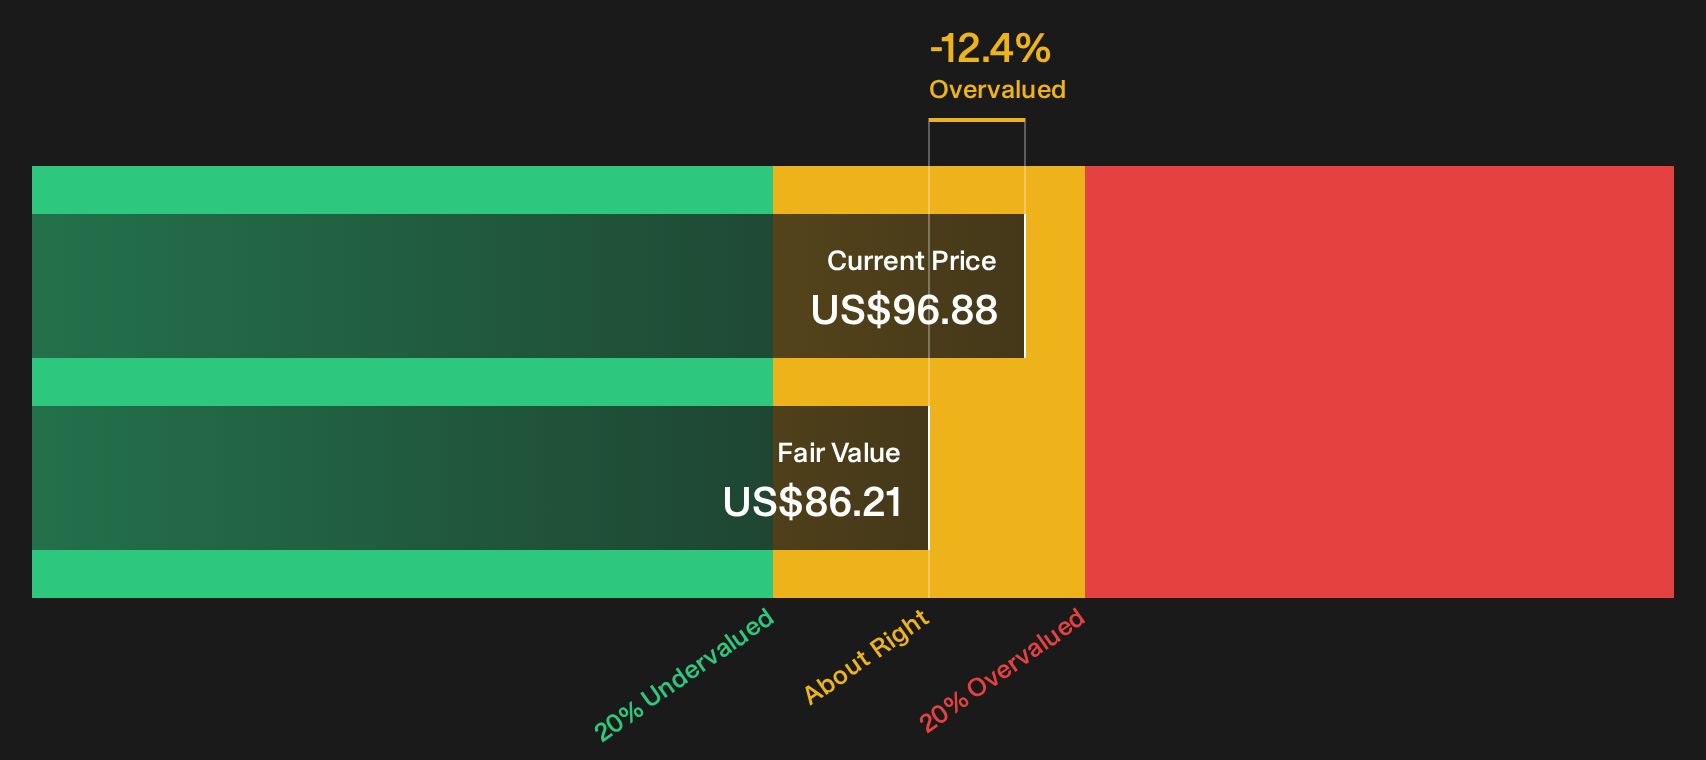
The Discounted Cash Flow (DCF) model estimates what lululemon athletica might be worth based on the cash it is expected to produce for shareholders. Over the last twelve months the business generated free cash flow of about $1.28b, and the model assumes those cash flows soften from recent levels rather than compound aggressively higher. On that set of projections, the DCF points to an intrinsic value of about $86 per share.
That figure sits below the current market price, implying the stock screens roughly 12.4% overvalued on this cash flow view. The recent plunge following multiple sales guidance cuts and weak comparable store trends helps explain why investors are questioning how durable lululemon athletica’s cash generation really is against those assumptions.
On this DCF framework, lululemon athletica appears overvalued relative to the cash flows currently built into the model.
Our Discounted Cash Flow (DCF) analysis suggests lululemon athletica may be overvalued by 12.4%. Discover 33 high quality undervalued stocks or create your own screener to find better value opportunities.
Is lululemon athletica a Bargain on Earnings?
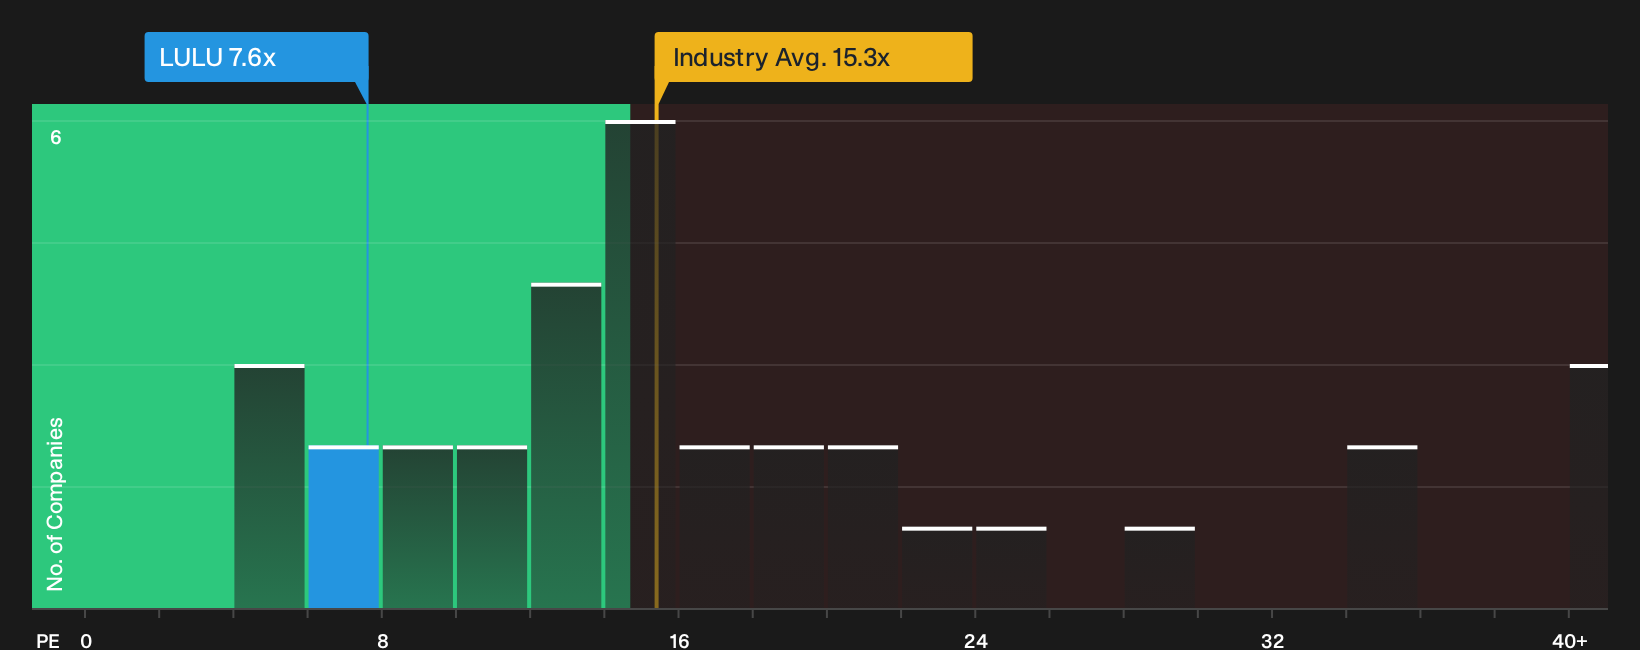
P/E works well for lululemon athletica because earnings quality and profitability sit at the center of how investors judge a mature consumer brand. On this lens, the stock trades on about 7.6x earnings, which is well below the Luxury industry average of roughly 15.3x and also under the broader peer group on about 19.7x.
A more tailored “fair” P/E for lululemon athletica that blends its sector, margins, size and risk comes out closer to 13.9x. The current tag near 7.6x is therefore a steep discount to what this framework would normally assign, even after the heavy reset driven by weaker sales trends and brand issues.
On the P/E yardstick, lululemon athletica currently appears undervalued versus both its industry and what the model treats as a fair multiple.
See what the numbers say about this price — find out in our valuation breakdown.
The lululemon athletica Narrative: What Would Justify Today's Price?
Simply Wall St Narratives pick up where that valuation puzzle leaves off for lululemon athletica, by spelling out which future paths for growth, margins and earnings would need to play out for today’s share price to move meaningfully higher or lower. Each narrative ties its number to a specific view on how lululemon athletica's revenue trajectory, profitability and risk profile might shift, giving you a reference point you can revisit as fresh information comes through the Community page.
Community narratives on lululemon athletica sit far apart, with one side treating the slump as an opportunity and the other as a warning.
Bull case: 30% undervalued
"A premium athletic apparel brand earns a 24% return on invested capital... "
Read the full Bull Case to see why lululemon athletica could be undervalued
Bear case: 120% overvalued
"Slowing growth in key North American markets signals rising saturation, with management guiding to flat or declining revenues in the U.S. and Canada... "
Read the full Bear Case to see why lululemon athletica could be overvalued
Do you think there's more to the story for lululemon athletica? Head over to our Community to see what others are saying!
The Bottom Line
Lululemon athletica screens as overvalued on the Discounted Cash Flow (DCF) intrinsic value estimate, yet looks undervalued on earnings multiples that compare it with peers. That split reflects a clash between cash flow assumptions on one side and expectations for growth, sentiment and peer re-rating on the other. With the broader valuation checks landing in mixed territory, the key question is whether current sales pressures and brand work lead to stabilising cash generation or a more structural earnings reset. The crux for investors is whether the discount on P/E signals mispricing or flags a potential value trap if execution around demand and product repositioning disappoints.
This article by Simply Wall St is general in nature. We provide commentary based on historical data and analyst forecasts only using an unbiased methodology and our articles are not intended to be financial advice. It does not constitute a recommendation to buy or sell any stock, and does not take account of your objectives, or your financial situation. We aim to bring you long-term focused analysis driven by fundamental data. Note that our analysis may not factor in the latest price-sensitive company announcements or qualitative material. Simply Wall St has no position in any stocks mentioned.
Have feedback on this article? Concerned about the content? Get in touch with us directly. Alternatively, email editorial-team@simplywallst.com