
Does Profitability Pressure Change The Bull Case For RadNet Stock (RDNT)?
- RadNet recently highlighted free public prostate cancer education and a high-profile healthcare conference appearance, while facing pressure on earnings per share, free cash flow, and return on invested capital.
- The contrast between expanding AI imaging initiatives and constrained cash generation raises questions about how RadNet funds growth without diluting shareholder value or stretching its balance sheet.
- We will now look at how RadNet's weaker earnings and free cash flow profile could reshape the longer term investment narrative.
Scan beyond RadNet for other medical imaging and healthcare operators where balance sheet strength and cash generation align more cleanly with growth stories using our hand picked list of solid balance sheet and fundamentals (23 results).
RadNet Investment Narrative Recap
To own RadNet, you need to believe its outpatient imaging footprint and AI tools can eventually turn solid US$2.3b revenue into consistent profits and better returns on capital. The short term debate centers on whether center throughput and workflow software can offset weaker earnings per share, tight free cash flow and falling return on invested capital.
The biggest near term swing factor is execution on AI and workflow platforms, without further stressing a balance sheet where interest costs are not well covered by earnings. The main risk is that reimbursement pressure, underused capacity or integration issues leave RadNet with higher costs, modest margins and limited financial flexibility.
The most relevant recent update is RadNet presenting at the Morgan Stanley Global Healthcare Conference on 16 September 2026. That appearance keeps the focus on how management explains the trade off between heavy AI and digital health spending and the current absence of profit, particularly given that interest coverage already looks thin.
For you, the conference matters if it clarifies milestones for improving free cash flow, integrating assets such as iCAD and See-Mode and stabilizing return on invested capital. Any detail on the pacing of new center openings, payer contracts and capital intensity helps you judge whether the existing growth plan can support the forecast earnings ramp without putting additional pressure on the balance sheet.
RadNet's narrative projects US$3.2b revenue and US$155.5 million earnings by 2029. This implies 12.2% yearly revenue growth and an earnings swing of about US$176.6 million from a current loss of US$21.1 million to the 2029 consensus forecast.
Uncover why RadNet's fair value indicates a 25% potential upside to its current price, which could narrow quickly.
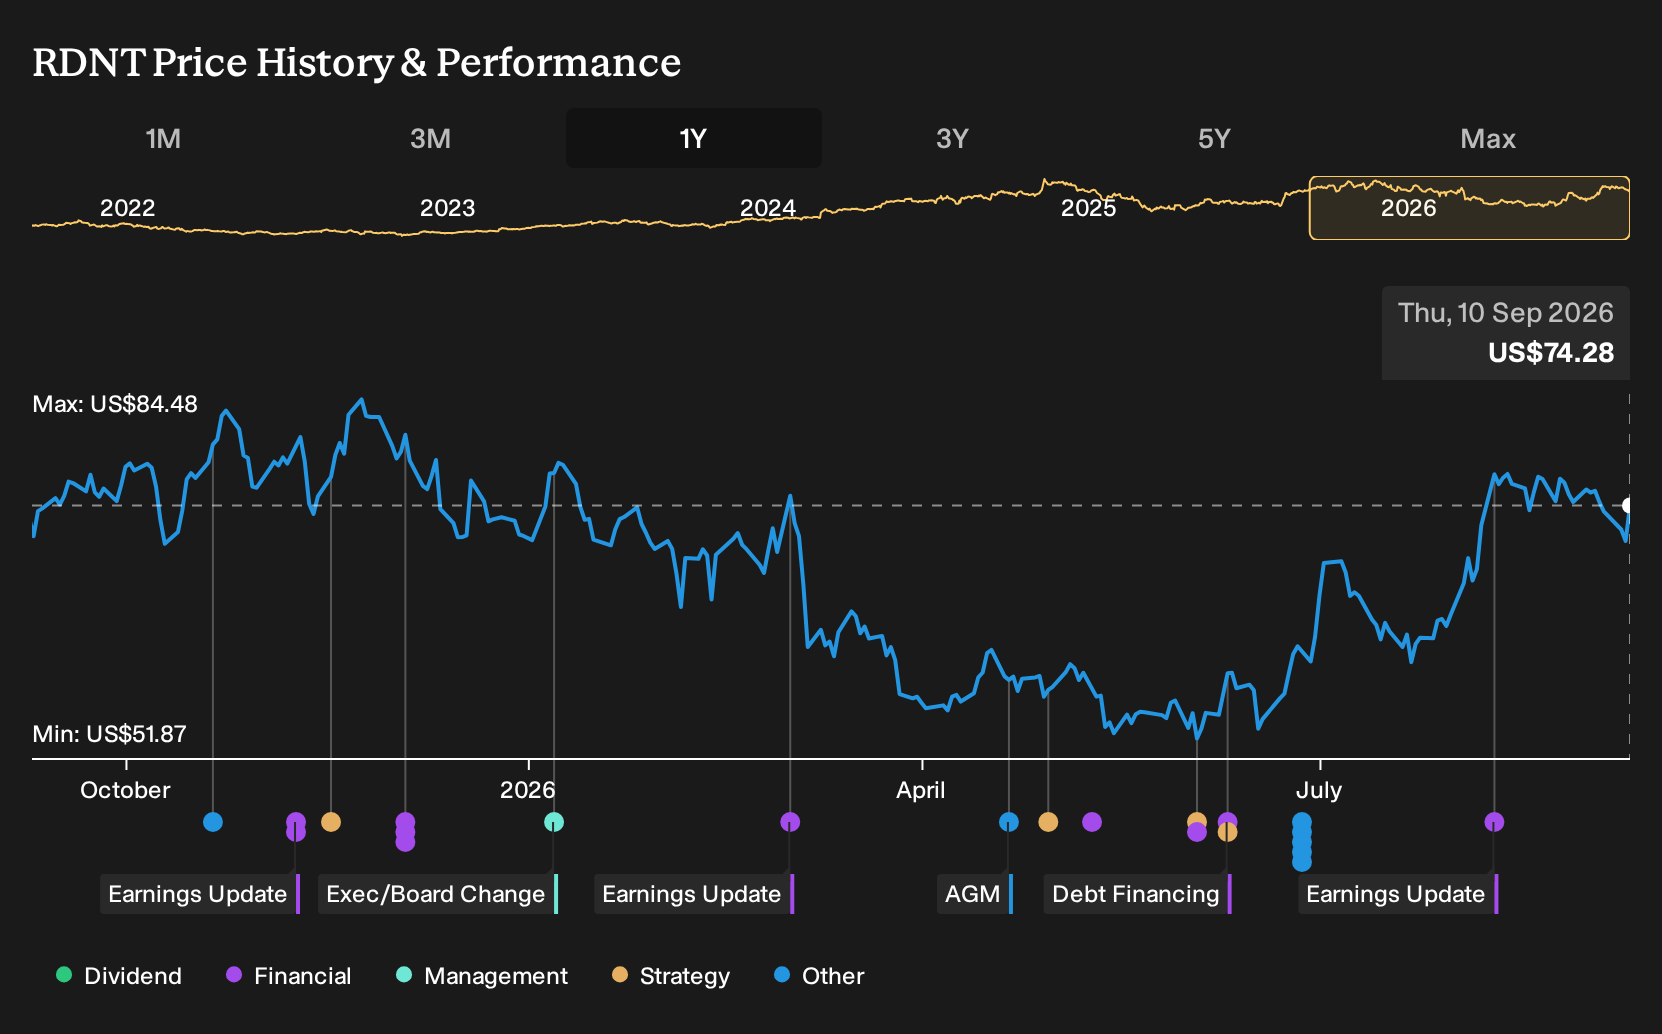
Exploring Other Perspectives
One alternate angle on RadNet focuses on liquidity as a potential accelerator rather than a constraint. Some of the more optimistic analysts highlighted the US$726.3 million cash position and 1.8x net debt to adjusted EBITDA, and were already modeling US$3.3b revenue and US$178.9 million earnings for 2029. Those forecasts predate this webinar and conference news, so opinions may shift. Investors may want to consider several viewpoints before deciding which narrative they find most compelling.
Explore 2 other RadNet fair value estimates, including one that suggests there may be as much as 30% upside from the current price.
Form Your Own Verdict
Disagree with existing narratives? Extraordinary investment returns rarely come from following the herd, so go with your instincts.
- A great starting point for your RadNet research is our analysis highlighting 3 key rewards and 2 important warning signs that could impact your investment decision.
- See our latest analysis for RadNet. The report includes a comprehensive fundamental analysis summarized in a single visual, the Snowflake, making it easy to evaluate RadNet's overall financial health at a glance.
Looking For More Investment Ideas Beyond RadNet?
Once you have a handle on RadNet, it can help to put the story in context by comparing it with other listed businesses that match your risk tolerance and income or growth goals.
- For investors hunting for mispriced quality, scan a curated set of companies that combine robust fundamentals with valuation support using our 33 high quality undervalued stocks.
- If capital preservation matters most to you, focus on businesses with steadier profiles and lower risk scores through the 11 resilient stocks with low risk scores.
- When income is a priority, sort for companies offering higher yields and sturdier payout histories with the 6 dividend fortresses.
This article by Simply Wall St is general in nature. We provide commentary based on historical data and analyst forecasts only using an unbiased methodology and our articles are not intended to be financial advice. It does not constitute a recommendation to buy or sell any stock, and does not take account of your objectives, or your financial situation. We aim to bring you long-term focused analysis driven by fundamental data. Note that our analysis may not factor in the latest price-sensitive company announcements or qualitative material. Simply Wall St has no position in any stocks mentioned.
Have feedback on this article? Concerned about the content? Get in touch with us directly. Alternatively, email editorial-team@simplywallst.com