
Barclays (LSE:BARC) Stock May Trade At A Discount On Fresh Financing News
Barclays has delivered a very strong 3 year run, yet its current valuation checks point to a stock that still screens cheap on most fundamental measures. The Excess Returns intrinsic value estimate suggests the shares trade at a steep discount to what the model implies, while market multiples look broadly in line with peers.
- Over the past 3 years, Barclays has returned about 232.4%, which puts recent weakness into context and raises the question of how much of that gain is now backed by fundamentals.
- Recent moves to lead large financings and grow the private banking hub in Singapore can support long term earnings power, while legal action tied to Covid era loan defaulters may weigh on perceived risk and future credit costs.
- On Simply Wall St's broader checks, Barclays carries a high value score of 5 out of 6, which points to a share price that leans cheap rather than fully priced in.
The issue now is whether Barclays' current discount to the Excess Returns intrinsic value estimate fairly reflects its risks, or if the market is underpricing the bank after such a strong multi year run.
Spot potential Barclays style value setups by scanning 10 high quality undervalued stocks for balance sheets and cash flows that currently screen cheap on core fundamentals.Is Barclays a Bargain on Excess Returns?
The Excess Returns model looks at how efficiently Barclays can compound shareholder capital above its own cost of equity. For this bank, the gap between those two numbers is where most of the estimated value comes from.
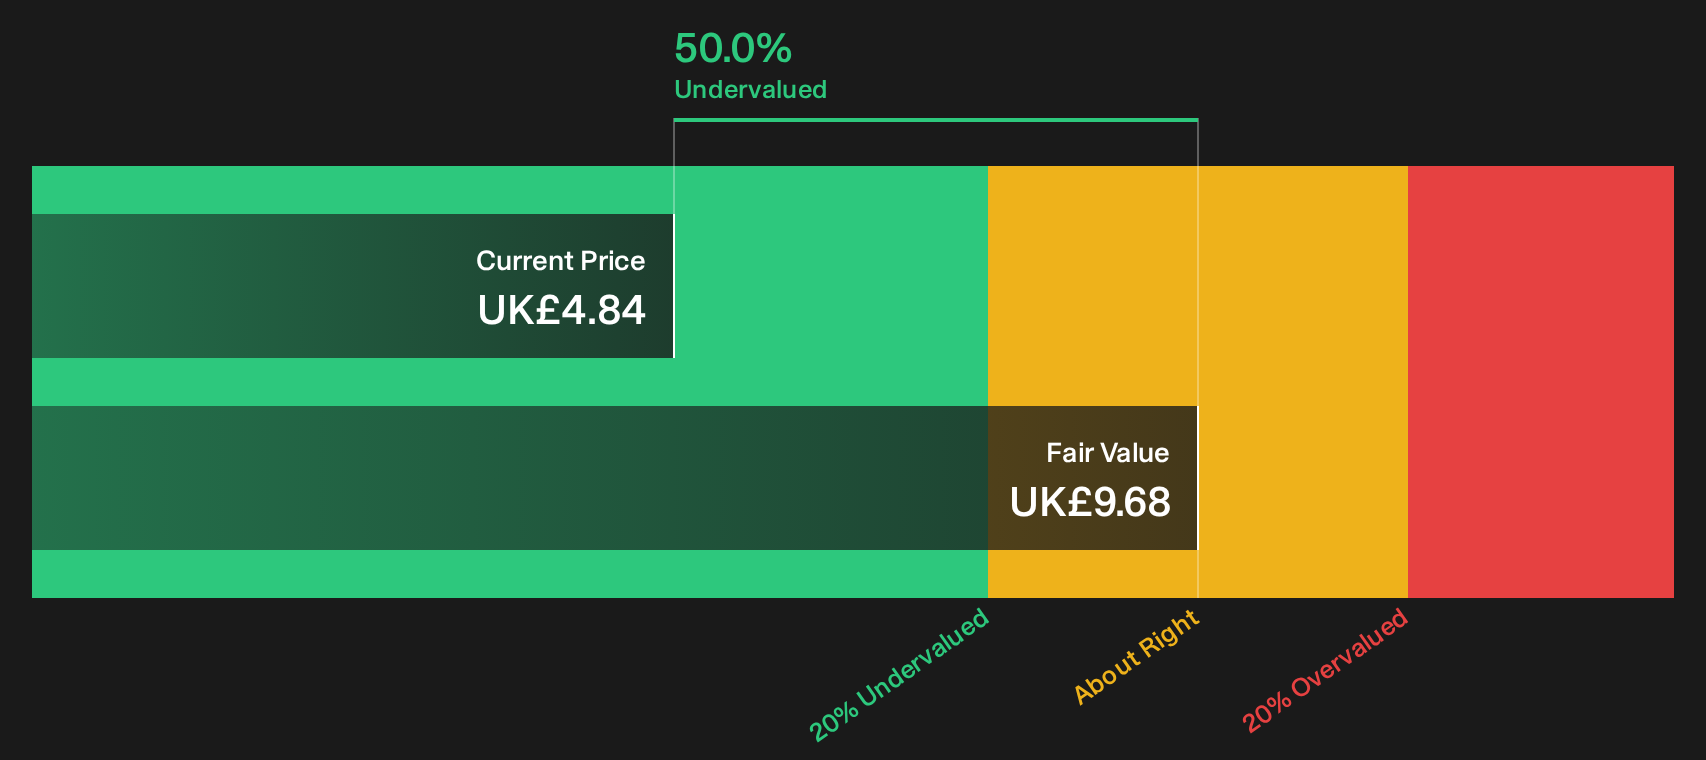
Barclays is modeled with a Book Value of £4.87 per share and a Stable EPS of £0.67 per share, against a Cost of Equity of £0.48 per share. That leaves an Excess Return of £0.19 per share on an Average Return on Equity of 11.83%, with Stable Book Value projected at £5.66 per share. Put together, the Excess Returns valuation points to an intrinsic value of about £9.68 per share, which implies the stock is roughly 50.0% undervalued versus the current price.
Legal action against Covid era loan defaulters helps explain why the market still prices in a higher risk profile than this intrinsic value suggests.
On this model, Barclays appears undervalued relative to the earnings power implied by its book and return profile.
Our Excess Returns analysis suggests Barclays is undervalued by 50.0%. Track this in your watchlist or portfolio, or discover 10 more high quality undervalued stocks.
Where Does Barclays Sit on Earnings?
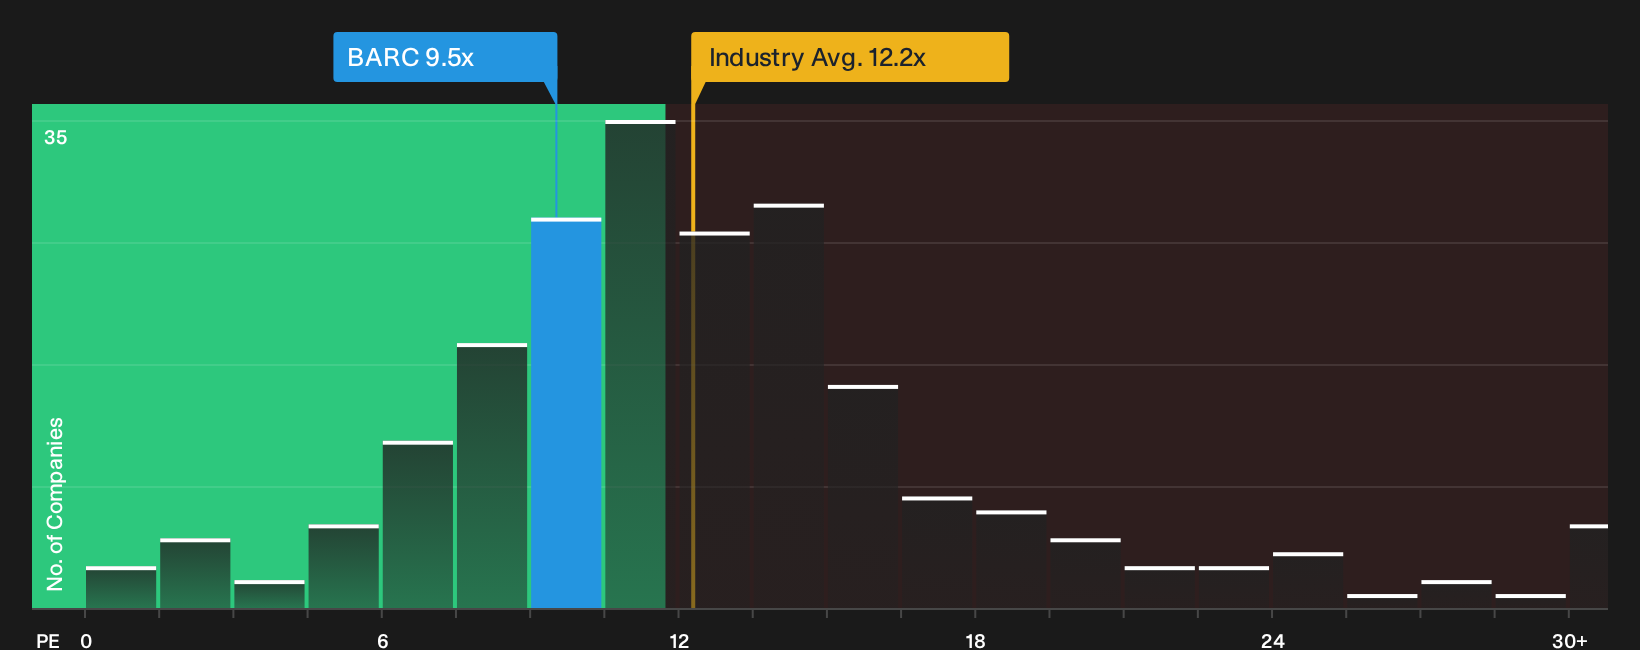
P/E fits Barclays well because earnings are still the main yardstick investors use for large banks. On this measure, the stock trades on about 9.5x earnings, which sits below the wider Banks sector on 11.5x and also below the peer average near 13.2x. That points to a cautious earnings multiple even after the strong three year share price run.
The tailored fair P/E ratio for Barclays is about 10.0x based on its profitability profile and risk inputs, only slightly above where the shares change hands today. The gap between the current 9.5x and this modelled level is modest, so the stock does not screen as aggressively cheap or stretched on earnings.
On the P/E yardstick, Barclays appears to be trading at roughly a fair valuation.
See what the numbers say about this price — find out in our valuation breakdown.
The Barclays Narrative: What Would Justify Today's Price?
Simply Wall St Narratives pick up where the Barclays valuation puzzle leaves off by spelling out which combinations of future growth, margins and earnings paths would need to play out for the shares to be worth materially more or less than today's price through a range of scenarios on the Community page. Rather than relying on a single multiple or model, each one lays out the assumptions behind its fair value so you can line them up against actual results over time.
One of the top community narratives on Barclays: 14% undervalued
"Management also appears confident in the bank's prospects, undertaking share buybacks while maintaining a dividend for shareholders..."
Read one of the top narratives on Barclays
Do you think there's more to the story for Barclays? Head over to our Community to see what others are saying!
The Bottom Line
Barclays screens as undervalued on the Excess Returns intrinsic value estimate, yet its P/E multiple suggests the shares are now closer to a middle-of-the-road earnings valuation than a deep discount. The broader value checks still lean supportive, which keeps the debate focused on whether the intrinsic value view is overestimating sustainable returns on equity or the market is still overpricing legal and credit risk. What matters from here is whether that risk premium fades. The crux is whether Covid era and other credit issues stay contained enough for the valuation gap to close rather than prove to be a value trap.
This article by Simply Wall St is general in nature. We provide commentary based on historical data and analyst forecasts only using an unbiased methodology and our articles are not intended to be financial advice. It does not constitute a recommendation to buy or sell any stock, and does not take account of your objectives, or your financial situation. We aim to bring you long-term focused analysis driven by fundamental data. Note that our analysis may not factor in the latest price-sensitive company announcements or qualitative material. Simply Wall St has no position in any stocks mentioned.
Have feedback on this article? Concerned about the content? Get in touch with us directly. Alternatively, email editorial-team@simplywallst.com