
Hornbeck Offshore Services (HOS) Files New ESOP Shares, Is The Stock Fully Valued?
Hornbeck Offshore Services (HOS) has filed two shelf registrations tied to employee stock ownership plan offerings, totaling roughly $23.2 million of common equity, shortly after closing its all stock combination with Helix Energy Solutions Group.
Hornbeck Offshore Services is trading at US$9.00, and the share price has declined 1.3% over the past day and 4.2% across the last week, extending a year to date share price return of down 12.9% as investors weigh softer recent earnings, refreshed credit facilities, governance changes and the fresh ESOP related equity capacity following the Helix combination.
Scan a curated group of offshore and energy service stocks that share similar capital and earnings crosscurrents to Hornbeck Offshore Services using the list of solid balance sheet and fundamentals (23 results).
Hornbeck Offshore Services is now a freshly combined offshore operator with softer recent earnings and new equity overhang, meeting a cheaper share price. Does that set up a reasonable entry today, or justify waiting for more clarity on value?
Price-to-Earnings of 22.4x: Is it justified?
On a headline measure, Hornbeck Offshore Services trades on a P/E of 22.4x, which sits below the wider US Energy Services industry at 27.3x but above a tighter peer group average of 12.2x. The share price at $9.00 therefore reflects a richer multiple than close peers even as it screens cheaper than the broader sector.
The P/E ratio compares what investors currently pay per share to the earnings generated per share. For a marine transportation and offshore service operator like Hornbeck Offshore Services, that metric often acts as a shorthand for how the market is weighing earnings quality, cyclicality in offshore activity, and the durability of current profit levels. A higher multiple can signal that investors are comfortable paying more for each dollar of profit, or that they expect earnings to hold up better through the cycle.
Hornbeck Offshore Services brings a mix of signals to that debate. Earnings grew 4.5% over the past year, which is ahead of the Energy Services industry that saw earnings decline by 13.2% over the same period, and the business has moved from losses to profitability over the last 5 years, with average earnings growth of 31.9% per year across that stretch. Return on equity sits at 21.3%, which is classified as high in this framework, and profit margins of 17.7% are described as high quality earnings even though they are slightly lower than last year’s 18.1%. That combination can help explain why the market is prepared to pay more per dollar of earnings than the 12.2x peer average, even if the stock does not command a premium to the broader sector multiple.
Relative to the US Energy Services industry, the P/E of 22.4x implies Hornbeck Offshore Services trades at a discount to the 27.3x sector average, which frames it as cheaper than many listed energy service stocks on this measure. Against the peer subset at 12.2x P/E, the shares look more expensive, suggesting investors are assigning a higher value to this earnings stream than to similar sized operators. There is no fair ratio estimate available from regression analysis here, so the multiple cannot be compared to a modelled “should be” level that the market might eventually move toward.
See what the numbers say about this price — find out in our valuation breakdown.
Result: Price-to-Earnings of 22.4x (ABOUT RIGHT)
Still, the recent share price slide and fresh ESOP related equity capacity could pressure sentiment if Hornbeck Offshore Services reports weaker earnings or slower contract activity.
Find out about the key risks to this Hornbeck Offshore Services narrative.
Another View on Hornbeck Offshore Services: Cash Flows Point the Other Way
On earnings, Hornbeck Offshore Services appears roughly aligned with the sector, yet the SWS DCF model presents a very different picture. With the stock at $9.00 and an estimated future cash flow value of $3.07, this approach frames HOS as expensive. Which lens should investors rely on when the signals clash?
Look into how the SWS DCF model arrives at its fair value.
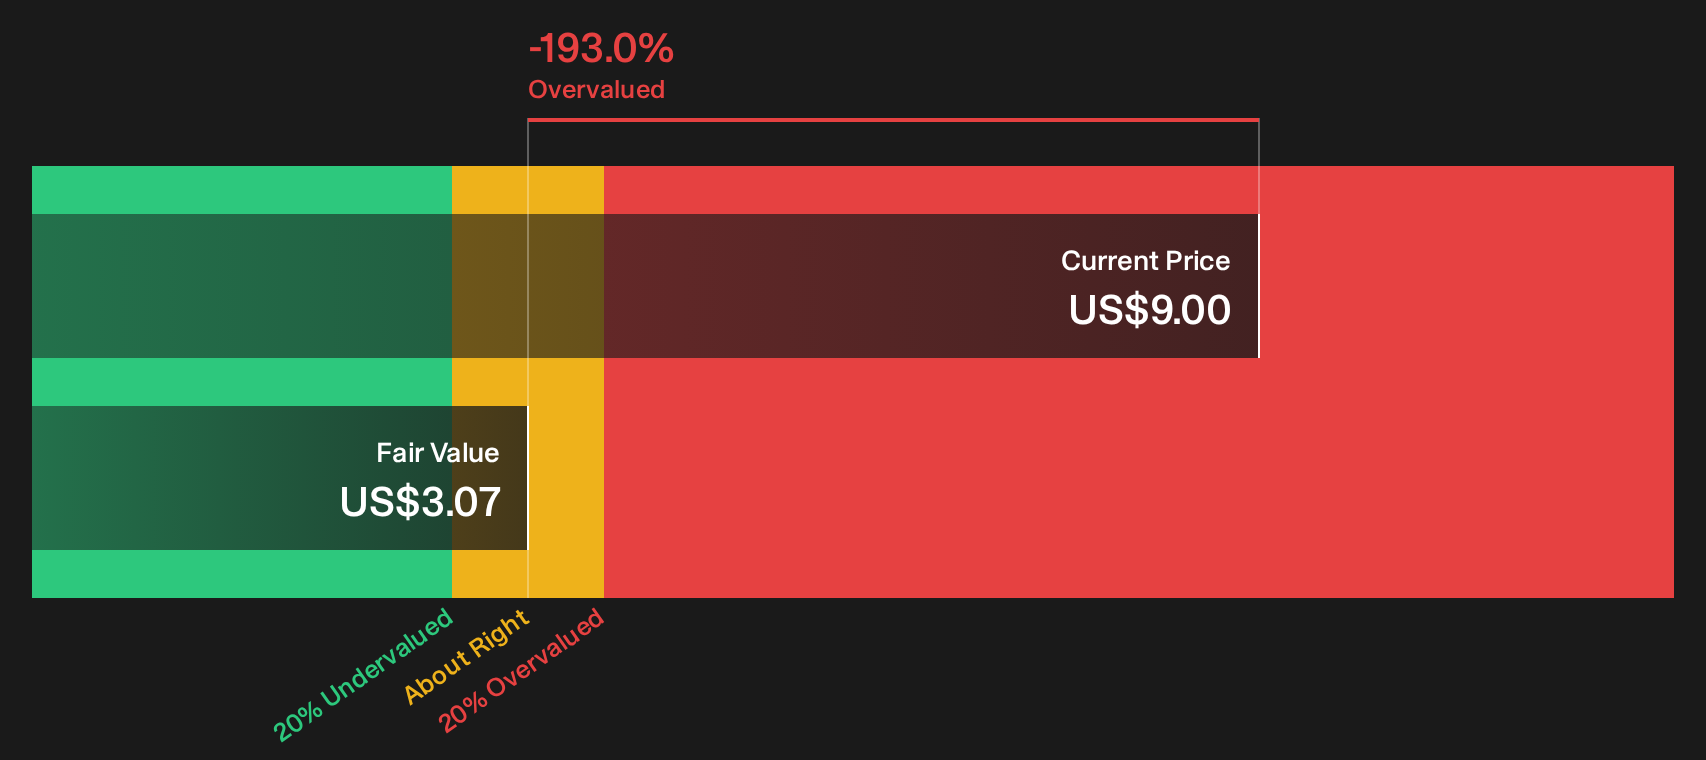
Simply Wall St performs a discounted cash flow (DCF) on every stock in the world every day (check out Hornbeck Offshore Services for example). We show the entire calculation in full. You can track the result in your watchlist or portfolio and be alerted when this changes, or use our stock screener to discover 33 high quality undervalued stocks. If you save a screener we even alert you when new companies match - so you never miss a potential opportunity.
Next Steps
Mixed feelings about Hornbeck Offshore Services after all that, or leaning one way already? Either way, move quickly, check the numbers and weigh both the 2 key rewards and 2 important warning signs.
Looking for more Hornbeck Offshore Services alternatives?
If Hornbeck Offshore Services leaves you unsure, do not stall. Fresh ideas matter. The right short list of candidates can change your next move.
- Target resilient balance sheets and steady fundamentals by scanning the list of solid balance sheet and fundamentals (23 results).
- Hunt for quality at a lower price point by reviewing the 33 high quality undervalued stocks.
- Prioritise smoother rides and fewer shocks by checking the 11 resilient stocks with low risk scores.
This article by Simply Wall St is general in nature. We provide commentary based on historical data and analyst forecasts only using an unbiased methodology and our articles are not intended to be financial advice. It does not constitute a recommendation to buy or sell any stock, and does not take account of your objectives, or your financial situation. We aim to bring you long-term focused analysis driven by fundamental data. Note that our analysis may not factor in the latest price-sensitive company announcements or qualitative material. Simply Wall St has no position in any stocks mentioned.
Have feedback on this article? Concerned about the content? Get in touch with us directly. Alternatively, email editorial-team@simplywallst.com