
Goldwin (TSE:8111) Could Be 59% Undervalued After Its Recent Share Price Slide
Goldwin (TSE:8111) has drawn fresh attention after recent trading left the share price around ¥2,081.5. Investors are reassessing the apparel specialist as returns over the past year and the past 3 months have both declined.
Recent trading fits a longer fade in momentum, with the share price return down over the past week and month, and the year-to-date share price return also lower. That trend lines up with a 1-year total shareholder return that has fallen 14.52% and a 3-year total shareholder return that has declined 39.77%. This suggests investors are reassessing both Goldwin’s growth prospects and risk profile rather than reacting to a single headline.
Balance recent weakness in Goldwin with a broader view and review our hand-picked 73 high quality undiscovered gems that may be flying under the radar.
Goldwin’s share slide could be echoing real pressure on the apparel business, or it could just reflect investors backing away from the story. Which explanation does the current valuation lean toward?
Price-to-Earnings of 12.3x: Is it justified?
Goldwin is trading on a P/E of 12.3x, which is below both its peer group on 20.5x and the wider JP Luxury sector on 15x.
The P/E ratio compares the current share price with earnings per share and gives a quick read on how much investors are paying for current profits. For a consumer apparel group with brands ranging from The North Face and Helly Hansen to Speedo and Allbirds, this kind of yardstick helps show whether the market is paying a premium for those labels or marking them down.
With analysts forecasting earnings to grow 5.6% per year and revenue to rise 4.7% per year, the current P/E suggests investors are assigning a lower value to those expected profits than to many Luxury peers. The stock is also trading below an estimated fair P/E of 15x, which is a level the market could move towards if sentiment on Goldwin’s earnings quality and growth profile improves.
That discount is not marginal. Versus peers on 20.5x and an estimated fair multiple of 15x, Goldwin’s 12.3x valuation appears materially lower than both its direct competitors and the modelled fair ratio.
Explore the SWS fair ratio for Goldwin.
Result: Price-to-Earnings of 12.3x (UNDERVALUED)
Still, the Goldwin story carries real risk if revenue growth of 4.68% and net income growth of 5.60% slow or if investor focus shifts away from Sporting Goods.
Find out about the key risks to this Goldwin narrative.
Another view on Goldwin’s value
On the first cut, Goldwin looks cheap on a P/E basis. A different lens tells a similar story. The SWS DCF model values future cash flows at ¥3,311.91 per share, compared with the current price of ¥2,081.5, which points to a sizeable undervaluation. Is that gap mispricing or a warning about earnings risk?
Look into how the SWS DCF model arrives at its fair value.
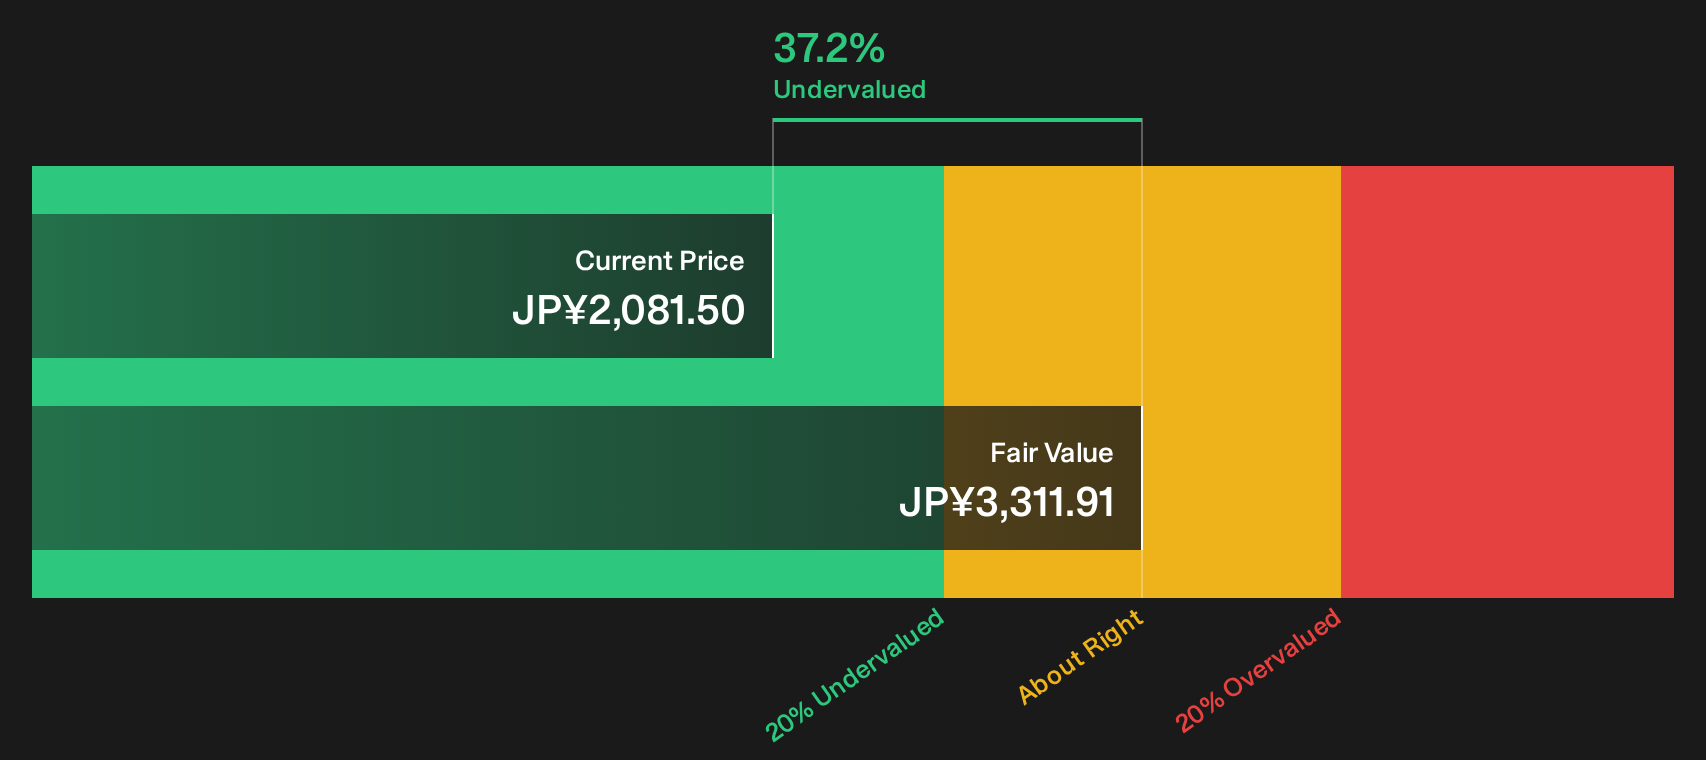
Simply Wall St performs a discounted cash flow (DCF) on every stock in the world every day (check out Goldwin for example). We show the entire calculation in full. You can track the result in your watchlist or portfolio and be alerted when this changes, or use our stock screener to discover 17 high quality undervalued stocks. If you save a screener we even alert you when new companies match - so you never miss a potential opportunity.
Next Steps
Uncertain about where sentiment on Goldwin really sits after this pullback and valuation gap? Check the key data points that matter to you and weigh both sides through the 4 key rewards and 1 important warning sign.
Looking for more investment ideas beyond Goldwin?
If Goldwin has you rethinking your portfolio, this is the moment to widen the lens and line up a few new candidates for your watchlist.
- Target potential bargains early by scanning companies flagged as high quality and potentially underpriced through the 17 high quality undervalued stocks.
- Strengthen your downside protection by focusing on businesses with resilient finances using the list of solid balance sheet and fundamentals (19 results).
- Prioritise stability and income by reviewing companies offering higher yields in the 18 dividend fortresses.
This article by Simply Wall St is general in nature. We provide commentary based on historical data and analyst forecasts only using an unbiased methodology and our articles are not intended to be financial advice. It does not constitute a recommendation to buy or sell any stock, and does not take account of your objectives, or your financial situation. We aim to bring you long-term focused analysis driven by fundamental data. Note that our analysis may not factor in the latest price-sensitive company announcements or qualitative material. Simply Wall St has no position in any stocks mentioned.
Have feedback on this article? Concerned about the content? Get in touch with us directly. Alternatively, email editorial-team@simplywallst.com