
Murphy USA (MUSA) Could Be 17% Undervalued Following Strong Earnings Momentum
Murphy USA (MUSA) is back on investors’ radar after attention around its earnings profile and asset efficiency coincided with a leadership shift in its accounting function involving a new principal accounting officer.
The recent reshuffle in Murphy USA’s accounting leadership comes at a time when the share price has pulled back over the past quarter, but still carries strong momentum over a longer horizon. The company has a year to date share price return of 29.72% and a 5 year total shareholder return of 239.01%, which continues to shape how investors weigh its earnings profile and perceived risk.
Scan for other fuel and convenience retailers with similar earnings momentum and balance sheet profiles by checking our hand picked list of list of solid balance sheet and fundamentals (23 results) alongside Murphy USA.
After a strong multi year run and a recent 15% pullback, Murphy USA now forces a harder question: Is meaningful upside still ahead, or has the bulk of the stock’s return already played out in the rearview mirror?
Most Popular Narrative: 16.7% Undervalued
Murphy USA’s most followed valuation story pegs fair value at $630.90 per share, compared with the last close of $525.78, which puts a clear spotlight on what assumptions sit underneath that gap.
Analysts are assuming Murphy USA's revenue will grow by 8.0% annually over the next 3 years.
Analysts assume that profit margins will shrink from 3.2% today to 2.5% in 3 years time.
Want to understand why a business with modest top line growth assumptions and thinner margins still lands on a higher price tag than today? The narrative focuses on where earnings settle years from now and what kind of earnings multiple investors are willing to pay at that point. If you care about how those moving pieces add up into that $630.90 figure, the full story is worth your time.
Result: Fair Value of $630.90 (UNDERVALUED)
Have a read of the narrative in full and understand what's behind the forecasts.
Still, Murphy USA’s story could be knocked off course if fuel demand keeps softening or if new store projects slip further against internal targets.
Find out about the key risks to this Murphy USA narrative.
Another View: Murphy USA Through A Cash Flow Lens
The narrative around Murphy USA leans on earnings multiples and analyst targets, yet the SWS DCF model is more conservative. On this framework, the stock trades at $525.78 against an estimated future cash flow value of $463.20, which screens as overvalued. Which story deserves more weight in your process?
Look into how the SWS DCF model arrives at its fair value.
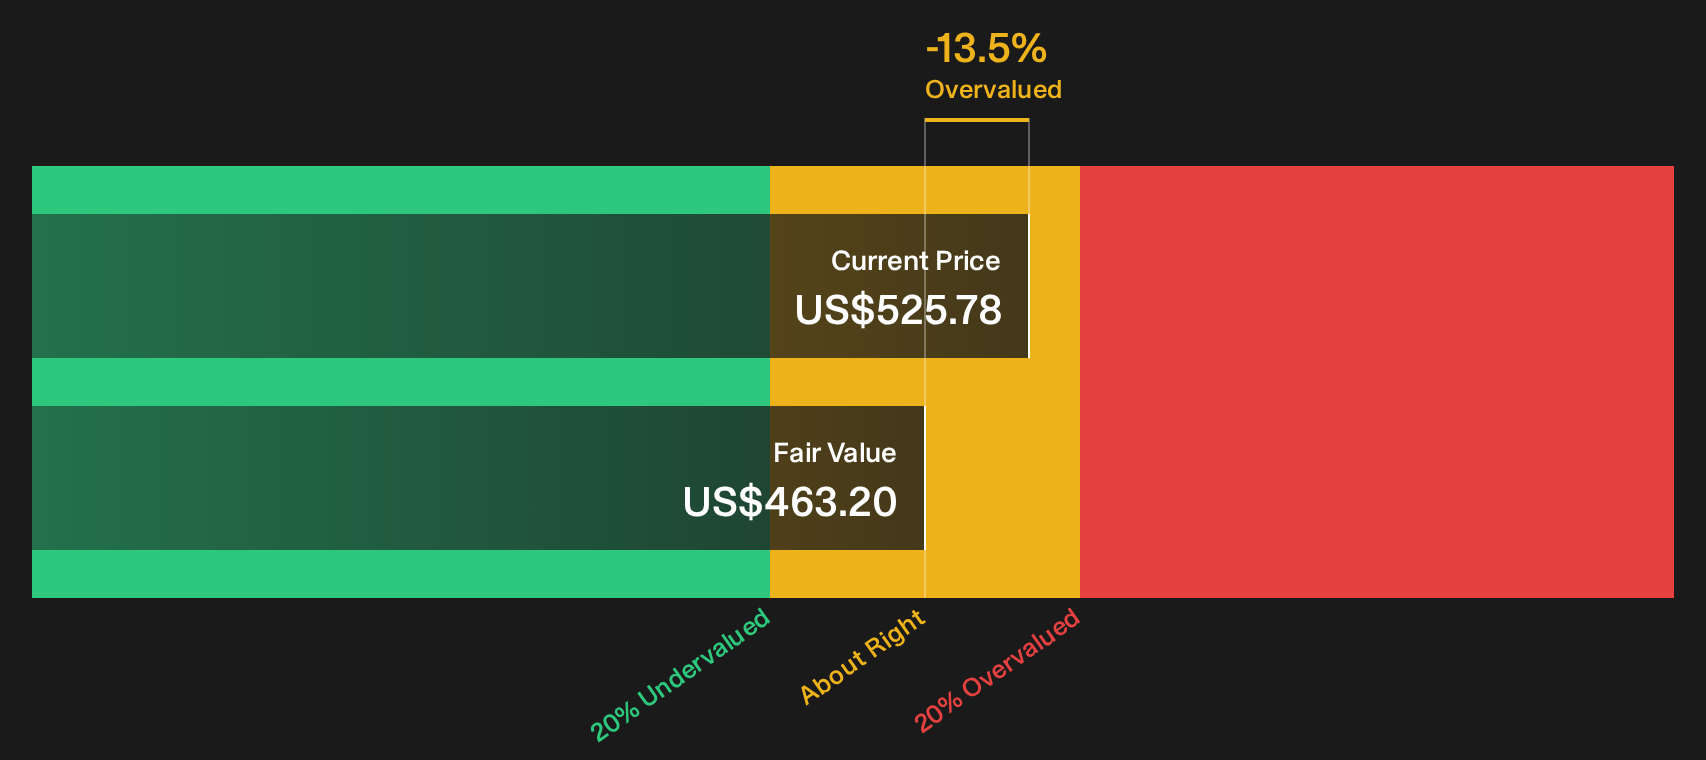
Simply Wall St performs a discounted cash flow (DCF) on every stock in the world every day (check out Murphy USA for example). We show the entire calculation in full. You can track the result in your watchlist or portfolio and be alerted when this changes, or use our stock screener to discover 33 high quality undervalued stocks. If you save a screener we even alert you when new companies match - so you never miss a potential opportunity.
Next Steps
If the mixed tone on Murphy USA so far feels unresolved, move quickly, review the underlying numbers, and weigh the 2 key rewards and 3 important warning signs.
Looking for more investment ideas beyond Murphy USA?
If Murphy USA sharpened your focus on quality, do not stop here. Broader idea sourcing now can shape the next leg of your portfolio decisions.
- Target potential mispricing by scanning companies that combine quality fundamentals with appealing valuations through the 33 high quality undervalued stocks.
- Strengthen your income stream by reviewing businesses with higher yields and resilient payout profiles using the 6 dividend fortresses.
- Dial down portfolio risk by filtering for resilient companies with steadier risk scores in the 11 resilient stocks with low risk scores.
This article by Simply Wall St is general in nature. We provide commentary based on historical data and analyst forecasts only using an unbiased methodology and our articles are not intended to be financial advice. It does not constitute a recommendation to buy or sell any stock, and does not take account of your objectives, or your financial situation. We aim to bring you long-term focused analysis driven by fundamental data. Note that our analysis may not factor in the latest price-sensitive company announcements or qualitative material. Simply Wall St has no position in any stocks mentioned.
Have feedback on this article? Concerned about the content? Get in touch with us directly. Alternatively, email editorial-team@simplywallst.com