
Preview of USDA September crop report & A look at history, El Niño, and more
(ZCZ26) (CORN) (ZSX26) (SOYB) (ZWZ26) (WEAT) (TAGS) (DBA) (CTZ26)
“Preview of big USDA September crop report & A look at history, El Niño, and more”
by Jim Roemer - Meteorologist - Commodity Trading Advisor - Principal, Best Weather Inc. & Climate Predict - Publisher, Weather Wealth Newsletter and Co-Producer of Climatelligence
Scott Mathews - Editor and Co-Producer of Climatelligence
- September 10, 2026
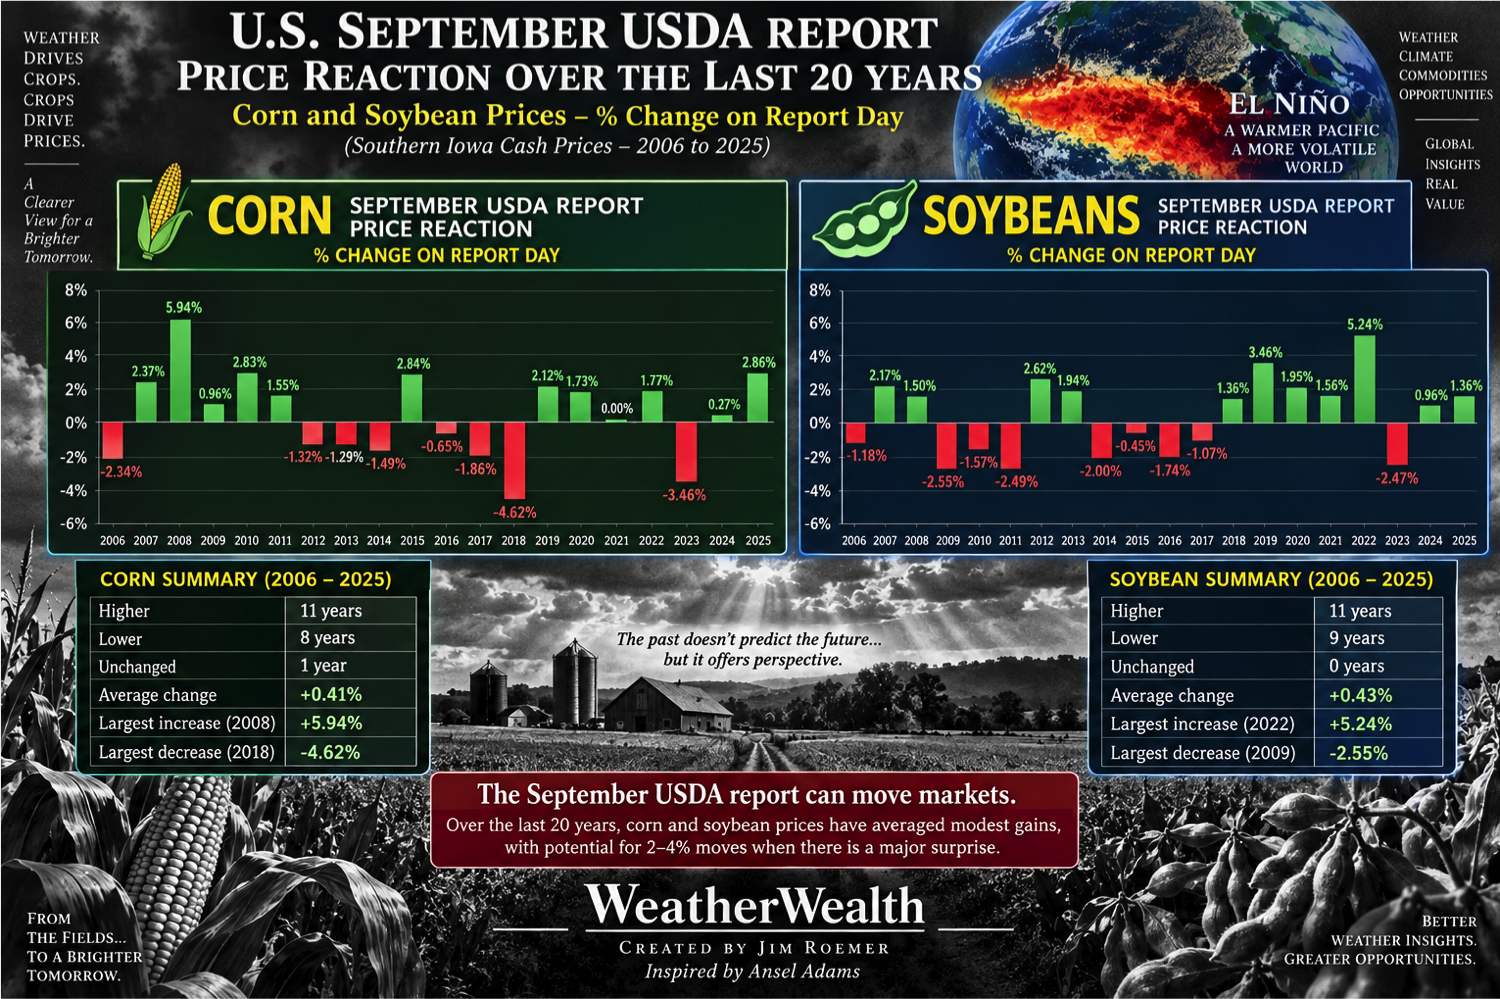
Above Montage: Designed by BestWeather, Inc., and rendered by ChatGPT (black & white photographs by Ansel Adams)
Have the USDA crop reporting methods changed, and what to expect?
Friday’s September Crop Production report is not expected to switch to a new, AI-driven estimation methodology. USDA has announced a modernization pilot involving improved satellite imagery, geospatial tools, crop models, and potential AI/machine-learning applications. However, the agriculture department has emphasized testing and validation “alongside” (not a replacement of) the established survey-based system.
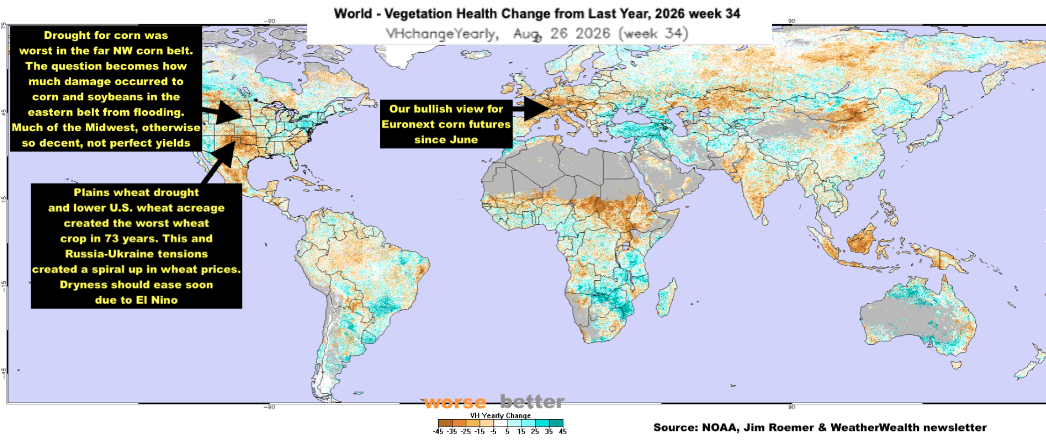
Satellite imagery (above) will be incorporated more into USDA crop estimates.
For the September report, the core NASS framework should remain familiar:
- September 1 farmer-survey indications for expected yields.
- The season’s first objective yield surveys for corn and soybeans—field-plot counts and measurements that are revisited through maturity and harvest.
Agricultural Statistics Board review of grower data, objective data, administrative acreage information, satellite imagery, weather, crop progress, and historical consistency. Satellite imagery, importantly, was already listed as an input in the August methodology; its mere use is not a new September change.
Source: esmis.nal.usda
So… the practical trading interpretation is: expect the usual September supply-demand shock potential from updated yield assumptions, rather than a one-time “AI methodology” break that makes the figures inherently non-comparable with August.
What history suggests about price reaction following the September crop report
The broad takeaway is surprisingly balanced. Corn rose in 11 of the 20 years, fell in 8, and was essentially unchanged once. Soybeans rose in 11 and fell in 9. The average September report-day reaction was about +0.41% for corn and +0.43% for soybeans—so, historically speaking, there is not a strong bearish September USDA-report bias.
The extremes are more interesting. Corn’s biggest positive reaction was +5.94% in 2008, while its largest decline was -4.62% in 2018.
Soybeans’ largest gain was +5.24% in 2022, while several bearish years produced roughly 2–2.5% declines. USDA’s raw data for these years show the underlying prior and report-day prices used in these calculations.
For 2026, this history suggests the September 11 report can certainly produce a 2–4% move if USDA substantially surprises us on corn or soybean yields.
B O T T O M L I N E:
Given this year’s concern about deteriorating corn yields and late-season soybean stress, a USDA yield number materially below expectations could produce a sharper-than-average bullish response. But “don’t hold a gun to my head” about this. If the markets soar after the report, we will begin to trade upcoming US harvest pressure for corn and soybeans. It looks quite wet for the corn belt the next week or two, but I am NOT convinced we are looking at major consistent harvest delays we had into October.
One more note: the severe drought in western Europe (that I consistently predicted all summer long ) could result in a more bullish supply/demand picture for corn. The question then becomes, do farmers hedge and sell into a big rally?
Comparison of the Midwest Summer of 2023, 2013 & 2007 to today
2023 was similar to this summer, but not nearly as extreme as this year. August 2023 had a remarkably sharp east-west moisture gradient. Drought intensified across the northern/western Midwest while it improved or disappeared across Illinois, Indiana, Michigan, and Ohio. Summer rainfall deficits of 4–10 inches were widespread in the northwest, while the south-entral/eastern Midwest had surpluses of 2–8 inches.
Then came the late-August heat dome. At the same time, northern Ohio experienced serious flash flooding (August 23–24), with some locations between Toledo and Cleveland receiving 5–7 inches of rain.
That makes 2023 a potential match, but perhaps NOT the best comparison to the summer of 2026.
Western/Northwestern Corn Belt: dry → drought → late heat stress
Eastern Corn Belt: excessive moisture/flooding
Soybeans: especially vulnerable because the extremes occurred during August.
And there’s an interesting market connection to our previous table:
September 2023 USDA report-day reaction
🌽 Corn: −3.46%
🌱 Soybeans: −2.47%
2007 is fascinating, but different
August 2007 produced truly extraordinary flooding from eastern Iowa and southern Wisconsin through northern Illinois, northern Indiana, and northwest Ohio. Northern Indiana and Ohio was hit with repeated torrential rains, and some locations accumulated 10–15 inches, producing major river flooding.
But the heat/drought configuration wasn’t quite like 2026. Severe drought existed both north and south of the heavy-rain corridor, while tremendous heat was concentrated farther south. Parts of Missouri, southern Illinois, Indiana, and Kentucky repeatedly exceeded 100°F.
Interestingly, following the September 2007 report:
🌽 Corn +2.37%
🌱 Soybeans +2.17%
That was considerably more bullish than 2023.
2013 is another one I’d study
August 2013 produced one of the most dramatic Midwest transitions from benign conditions into flash drought. Iowa had its 7th driest August, Illinois its 3rd driest, and Indiana its 4th driest. Drought coverage exploded from about 2% of the Midwest at the beginning of August to 28% by early September, and heat returned during the second half of August, rapidly deteriorating crops.
Meanwhile, portions of the southern/eastern Midwest had been extremely wet—Kentucky and Ohio had their 3rd and 5th wettest summers, respectively.
September 2013 USDA reaction:
🌽 Corn −1.29%
🌱 Soybeans +1.94%
That’s interesting because soybeans reacted bullishly while corn fell—consistent with August weather having greater leverage over soybean yield than late-season corn.
But 2026 may actually be more extreme
The piece that makes 2026 unusual is the magnitude of the eastern rainfall. Central Illinois just experienced its 5th-wettest August statewide, while individual locations were extraordinary:
Danville: 13.98″ — wettest August on record
Champaign-Urbana: 9.45″ — 4th wettest
Bloomington-Normal: 9.41″ — 4th wettest
Galesburg: 9.89″ — 4th wettest
Rivers reached flood stage in central Illinois.
Combine that with the western Corn Belt heat/dryness, and the pattern becomes unusually unfavorable because different mechanisms can reduce yields on opposite sides of the Corn Belt.
Isn't it confusing to look at all of these analogs? Yes, perhaps…
B O T T O M L I N E:
For 2026, therefore, I think the more important question is not whether the weather was bad—it clearly was in important areas—but whether USDA’s average guess by firms of September corn yield near 180.7 and soybean yield near 52.7 adequately captures the damage from the east-west weather extremes. That’s where a genuine September 11 surprise could come from. The next big market mover for grains will come from late September and October harvest weather, whether the Ukraine-Russian war tensions ease or not, and potentially improving weather this autumn for US Plains wheat areas.
We greatly appreciate your interest in Commodity Weather Intelligence!
Jim Roemer, Scott Mathews, and the BestWeather Team
Mr. Roemer owns Best Weather Inc., offering weather-related blogs for commodity traders and farmers. He is also a co-founder of Climate Predict, a detailed long-range global weather forecast tool. As one of the first meteorologists to become an NFA-registered Commodity Trading Advisor, he has worked with major hedge funds, Midwest farmers, and individual traders for over 35 years. With a special emphasis on interpreting market psychology, coupled with his short-term and long-term trend forecasting in grains, softs, and energy markets, he holds a unique standing among advisors in the commodity risk management industry.