
Plains All American Pipeline (PAA) Prices $1.5b Notes, Is The Stock Fully Priced?
Plains All American Pipeline (PAA) has priced a US$1.5 billion offering of junior subordinated notes due 2056. Management plans to use the proceeds to redeem all outstanding Series A and B preferred units.
Plains All American Pipeline’s share price has climbed over recent months, with a 30 day share price return of 11.13% and a 90 day gain of 14.99%. That short term momentum sits alongside a 1 year total shareholder return of 60.92% and 3 year total shareholder return of 117.44%, suggesting this latest junior subordinated notes deal is being digested in the context of an already strong multi year run.
Spot opportunities similar to Plains All American Pipeline's recent momentum by scanning our hand picked list of 31 high quality undervalued stocks that show strong fundamentals and potential mispricing.Plains All American Pipeline’s rally and fresh junior subordinated notes raise a simple tension: Is the price now echoing healthier fundamentals or leaning more on renewed enthusiasm around the stock as it trades near US$25.85?
Price-to-Earnings of 22.2x: Is it justified?
On valuation checks, Plains All American Pipeline screens as expensive on earnings, with a P/E ratio of 22.2x even after a strong run to $25.85.
The P/E multiple compares the current share price to earnings per share and reflects what investors are willing to pay today for each dollar of profit. For a midstream energy partnership like Plains All American Pipeline, that figure often embeds expectations about future profitability stability and capital intensity in a sector where cash generation can be heavily influenced by volumes and contract structures.
Against that backdrop, the stock trades on a richer earnings multiple than several benchmarks. PAA is described as expensive versus the US Oil and Gas industry average P/E of 12.9x and also above its peer average of 21.1x. It is also higher than an estimated fair P/E of 17.8x from the SWS fair ratio model, which suggests a level the market could move toward if sentiment or expectations on future profits change.
Explore the SWS fair ratio for Plains All American Pipeline.
Result: Price-to-Earnings of 22.2x (OVERVALUED)
Still, the story around Plains All American Pipeline can change quickly if energy transport volumes soften or if higher funding costs pressure returns on its large asset base.
Find out about the key risks to this Plains All American Pipeline narrative.
Another View on Plains All American Pipeline’s Value
The P/E test presents Plains All American Pipeline as expensive, yet the SWS DCF model suggests the opposite. At $25.85, the units are described as trading about 66.5% below an estimated future cash flow value of $77.22, which presents a very different picture for holders to consider.
This type of gap between an earnings-based yardstick and a cash flow-based fair value estimate raises a practical question: Is the market overpaying for near-term earnings, or underappreciating the longer-term cash generation profile implied by the DCF work?
Look into how the SWS DCF model arrives at its fair value..
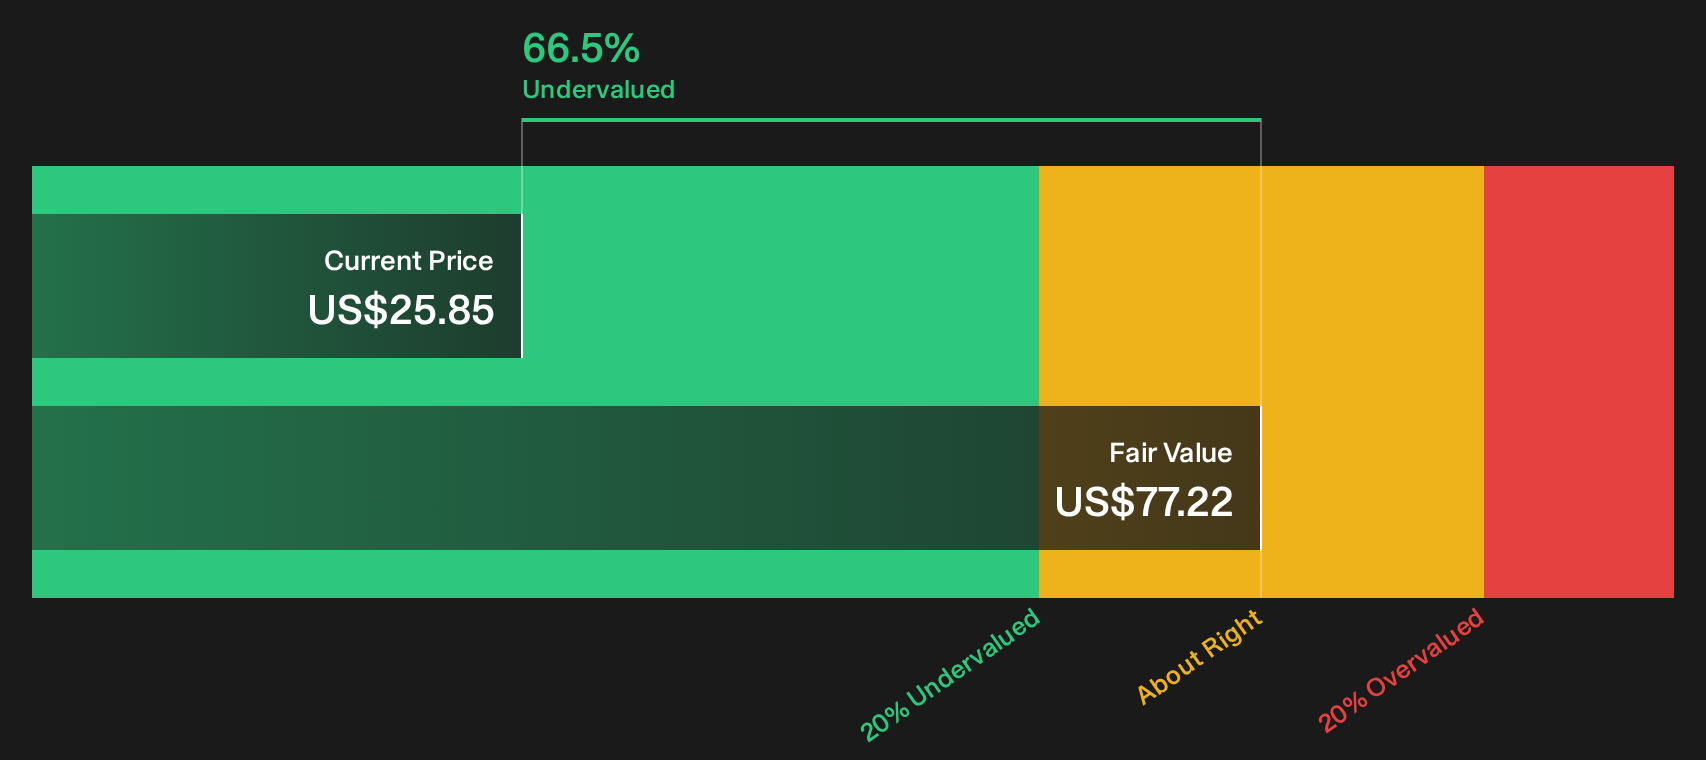
Simply Wall St performs a discounted cash flow (DCF) on every stock in the world every day (check out Plains All American Pipeline for example). We show the entire calculation in full. You can track the result in your watchlist or portfolio and be alerted when this changes, or use our stock screener to discover 31 high quality undervalued stocks. If you save a screener we even alert you when new companies match - so you never miss a potential opportunity.
Next Steps
Mixed signals around Plains All American Pipeline’s value and funding may leave you undecided, so move quickly, test the numbers yourself, and weigh both the risks and the upside in context with the 2 key rewards and 2 important warning signs.
Looking for more investment ideas beyond Plains All American Pipeline?
If you like what you see with Plains All American Pipeline but do not want to rely on a single story, broaden your watchlist using data driven stock ideas.
- Spot potential up and comers early by scanning 20 elite penny stocks with strong financials that already pair stronger financials with tighter risk controls than many tiny peers.
- Zero in on quality at a fair price by reviewing a focused 31 high quality undervalued stocks where cash flows and balance sheets do more of the talking than hype.
- Strengthen your income stream by checking a curated 6 dividend fortresses that targets higher yields while still screening for durability and financial discipline.
This article by Simply Wall St is general in nature. We provide commentary based on historical data and analyst forecasts only using an unbiased methodology and our articles are not intended to be financial advice. It does not constitute a recommendation to buy or sell any stock, and does not take account of your objectives, or your financial situation. We aim to bring you long-term focused analysis driven by fundamental data. Note that our analysis may not factor in the latest price-sensitive company announcements or qualitative material. Simply Wall St has no position in any stocks mentioned.
Have feedback on this article? Concerned about the content? Get in touch with us directly. Alternatively, email editorial-team@simplywallst.com