
Air Products (APD) Stock Looks Overvalued On Sales And Fair Value
Air Products and Chemicals stock has posted a 24.2% gain over the past five years, yet the valuation picture is split, with an intrinsic value estimate implying upside while market multiples lean the other way.
- Over the last 5 years, the share price return of 24.2% suggests investors have been rewarded for staying invested over a full cycle.
- Expectations for consistent cash generation can support the intrinsic value case, while any disappointment in future cash flows or higher capital needs may weigh on what investors are willing to pay.
- The broader valuation checks point to a low value score, with 1 out of 6 metrics screening as a potential bargain, so the stock does not screen as a clear value opportunity.
The issue now is whether Air Products and Chemicals is closer to the intrinsic value implied by discounted cash flows or the richer picture suggested by current market multiples.
Scan beyond Air Products and Chemicals and compare its mixed valuation signals with a curated list of 31 high quality undervalued stocks that combine balance sheet strength with potential pricing gaps.
Is Air Products and Chemicals Still Cheap on Cash Flow?
The Discounted Cash Flow (DCF) model here is built on the cash that Air Products and Chemicals is expected to generate for shareholders over time. Latest twelve month free cash flow sits in negative territory at about $1.82b, so the model assumes a recovery path where cash generation turns positive and then increases from there. That pattern feeds into a 2 Stage Free Cash Flow to Equity framework, which assumes an initial ramp up followed by a steadier phase as the business matures.
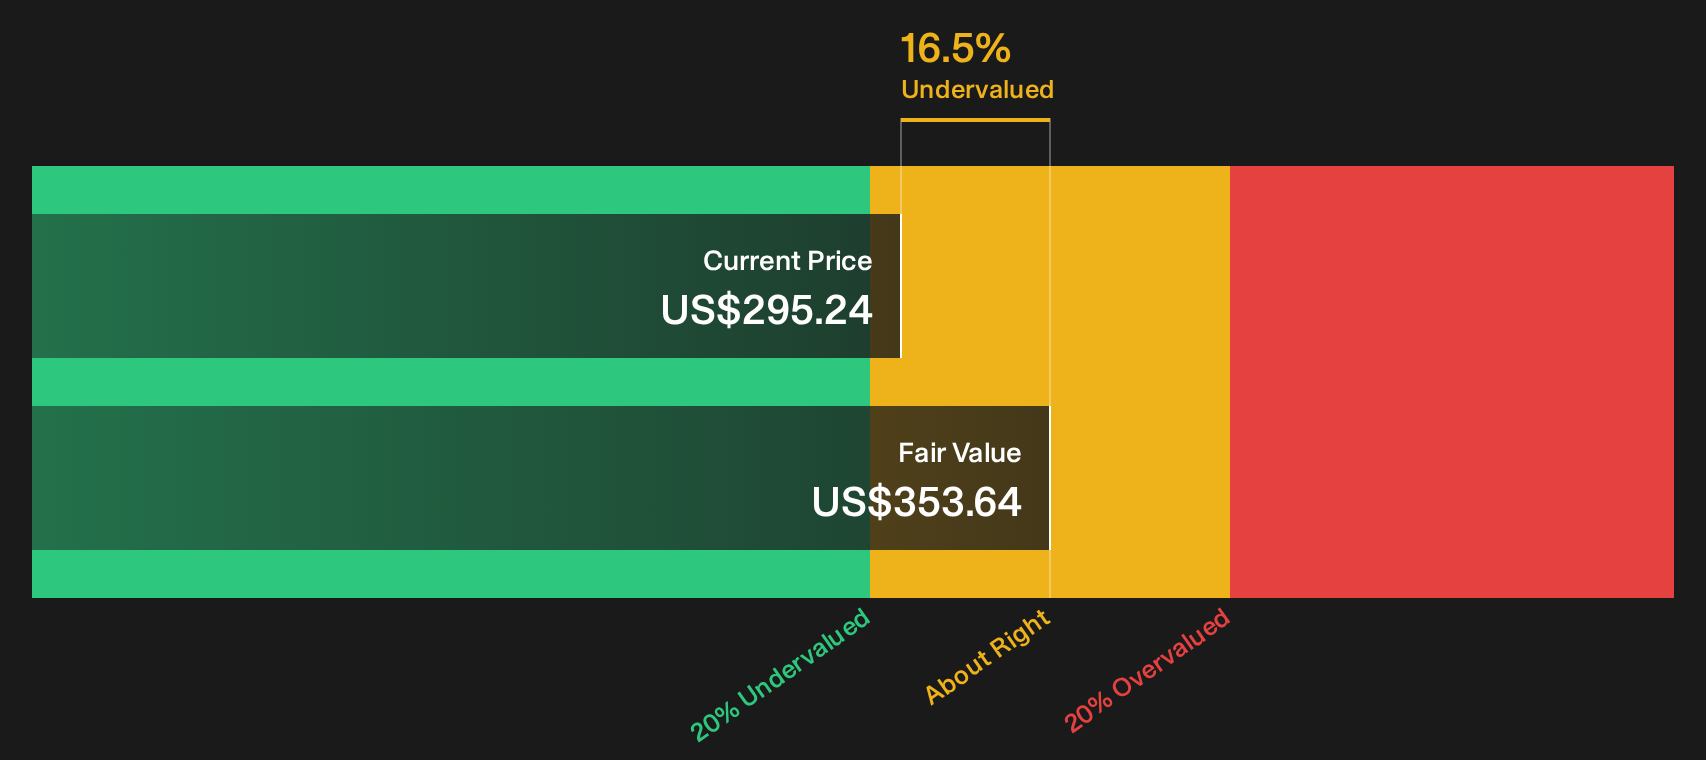
On those projections, the DCF model points to an estimated intrinsic value of about $354 per share. Compared with the current price, that suggests the stock appears roughly 16.5% undervalued on this cash flow view. The gap is based on the idea that future free cash flows normalise and rise enough to offset the recent cash outflow.
On this set of assumptions, Air Products and Chemicals stock appears undervalued relative to the DCF based estimate of intrinsic worth.
Our Discounted Cash Flow (DCF) analysis suggests Air Products and Chemicals is undervalued by 16.5%. Track this in your watchlist or portfolio, or discover 31 more high quality undervalued stocks.
Does Air Products and Chemicals Look Pricey on Sales?
P/S is a clean way to look at Air Products and Chemicals because revenue for industrial gases tends to be more stable than earnings in any single year.
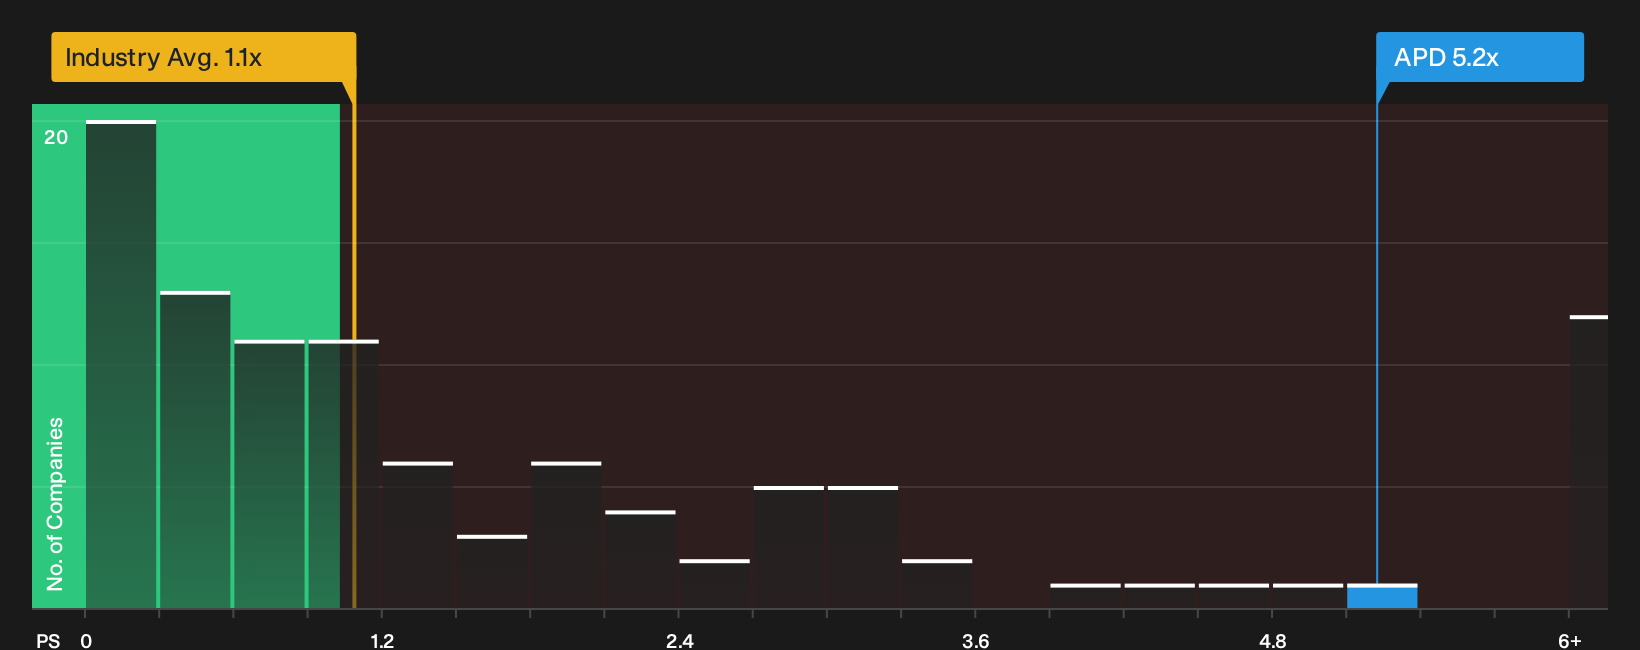
The stock trades on a P/S of about 5.2x, which is well above the Chemicals industry average of roughly 1.1x and also ahead of the peer group at about 4.2x. A tailored fair P/S ratio for Air Products and Chemicals, which adjusts for its size, margins and risk profile, sits closer to 2.5x. That is less than half of where the shares change hands today, so the market is assigning a premium price tag to each dollar of sales.
This gap suggests investors are already paying up for the current positioning of Air Products and Chemicals, rather than getting the shares at a discount relative to its own fundamentals and sector markers.
On the P/S yardstick, Air Products and Chemicals currently screens as overvalued.
See what the numbers say about this price — find out in our valuation breakdown.
The Air Products and Chemicals Narrative: What Would Justify Today's Price?
Simply Wall St Narratives for Air Products and Chemicals pick up where the valuation split leaves off and outline what kind of future in growth, profitability and earnings would need to unfold for the shares to be worth materially more or materially less than the current price on Air Products and Chemicals' Community page. Each scenario links its headline number to a clear view on how growth, margins and risk might evolve, which you can then revisit as new information emerges.
Share a narrative on Air Products and Chemicals' valuation story and present a clear, number-driven case on where its growth, margins and execution go from here.
Be one of the first voices in the Simply Wall St community to set out that thesis and track how it holds up as new results and market reactions come through.
Do you think there's more to the story for Air Products and Chemicals? Head over to our Community to see what others are saying!
The Bottom Line
For Air Products and Chemicals, the Discounted Cash Flow (DCF) view points to some upside, while the market multiple work flags the shares as overvalued on sales. That clash comes down to timing and sustainability of future cash generation on one side, and rich expectations already built into the current P/S on the other. Broader valuation checks remain weak, so the intrinsic value case needs cleaner cash flow and capital discipline to gain credibility. The key question now is whether future cash returns can catch up to the price investors are already paying for each dollar of revenue.
This article by Simply Wall St is general in nature. We provide commentary based on historical data and analyst forecasts only using an unbiased methodology and our articles are not intended to be financial advice. It does not constitute a recommendation to buy or sell any stock, and does not take account of your objectives, or your financial situation. We aim to bring you long-term focused analysis driven by fundamental data. Note that our analysis may not factor in the latest price-sensitive company announcements or qualitative material. Simply Wall St has no position in any stocks mentioned.
Have feedback on this article? Concerned about the content? Get in touch with us directly. Alternatively, email editorial-team@simplywallst.com