
Azbil (TSE:6845) Could Be 15% Undervalued Following Its Recent Pullback
Azbil (TSE:6845) has drawn attention after recent trading, with the share price at ¥1,448 and returns down over the past month and past 3 months, despite positive multi‑year total returns.
Recent trading paints a mixed picture for Azbil. The share price return is down over the past month and quarter, while the year-to-date share price return is slightly positive and multi year total shareholder returns remain in positive territory. This suggests that momentum has cooled even as long term holders still show a gain.
Compare Azbil's cooled momentum with other automation and industrial tech plays by scanning the hand picked 37 robotics and automation stocks that echo similar themes in control systems and smart infrastructure.
Azbil now trades after a pullback, with long term holders still ahead. Does that recent slide finally tilt the risk reward balance toward buyers, or has the easy upside already been priced in?
Most Popular Narrative: 15.3% Undervalued
Against Azbil's last close at ¥1,448, the most followed narrative anchors fair value at ¥1,710. This frames the recent pullback as a valuation gap rather than a broken story.
Higher shareholder returns via sustained dividend increases and sizable share buybacks, together with treasury share utilization, reduce balance sheet flexibility for large-scale overseas expansion or acquisitions. This could potentially moderate long term revenue and earnings growth.
Want to see why this narrative still points to upside? The core thesis leans on measured revenue growth, steady profitability and a richer future earnings multiple. Curious which specific long term forecasts have to line up for that to hold?
Result: Fair Value of ¥1,710 (UNDERVALUED)
Have a read of the narrative in full and understand what's behind the forecasts.
Still, Azbil could surprise investors if its medium term plan lifts margins more than expected, or if Building Automation demand remains stronger for a longer period.
Find out about the key risks to this Azbil narrative.
Another View On Azbil’s Valuation
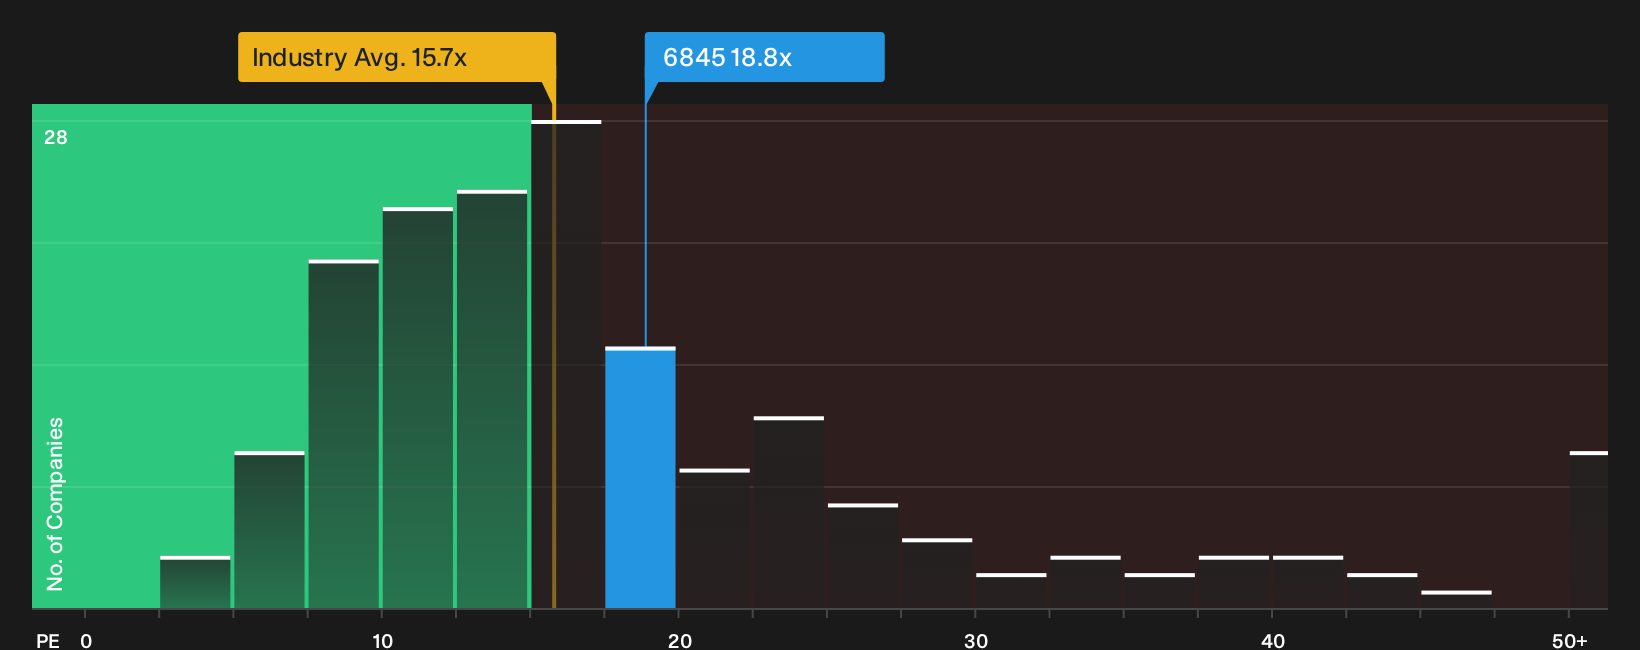
The story looks different when you switch from fair value estimates to simple earnings multiples. Azbil trades at a P/E of 18.8x. The JP Electronic industry sits nearer 15.7x, while the fair ratio points lower again at 15.6x. That gap leans more toward valuation risk than obvious upside. Which signal should carry more weight in your process?
For a closer look at how this earnings multiple compares with what the fair ratio suggests the market could move toward, See what the numbers say about this price — find out in our valuation breakdown.
Next Steps
Mixed signals around Azbil can make the story feel cloudy, so look through the numbers yourself and pressure test the bullish and cautious angles. To frame that decision with both sides of the ledger in mind, review the 1 key reward and 1 important warning sign.
Looking for more investment ideas beyond Azbil?
If Azbil has sharpened your thinking, do not stop there. Fresh ideas often come from comparing it with very different business models and balance sheet profiles.
- Hunt for potential mispricings by scanning a curated 17 high quality undervalued stocks that surface companies where solid fundamentals and current prices appear out of sync.
- Target resilience first by reviewing a list of solid balance sheet and fundamentals (19 results) that prioritises stronger financial footing before you even start weighing growth stories.
- Spot overlooked opportunities by running through a 73 high quality undiscovered gems that highlight quality businesses many investors are not watching yet.
This article by Simply Wall St is general in nature. We provide commentary based on historical data and analyst forecasts only using an unbiased methodology and our articles are not intended to be financial advice. It does not constitute a recommendation to buy or sell any stock, and does not take account of your objectives, or your financial situation. We aim to bring you long-term focused analysis driven by fundamental data. Note that our analysis may not factor in the latest price-sensitive company announcements or qualitative material. Simply Wall St has no position in any stocks mentioned.
Have feedback on this article? Concerned about the content? Get in touch with us directly. Alternatively, email editorial-team@simplywallst.com