
Honeywell (HON) Stock Could Be Priced Richly On Cash Flow Yet Cheap On Earnings
Honeywell International has had a rough year so far, with the share price down 47.7% year to date, while valuation checks are split between an intrinsic value estimate that flags the stock as expensive and market multiples that point to a possible discount.
- The near 47.7% year to date decline signals that Honeywell International is firmly in a reset phase, with expectations clearly lower than they were at the start of the year.
- Improving growth expectations after the Aerospace spin highlighted in recent analyst commentary can support higher cash flow projections, while any stumble in Building Automation or Energy and Sustainability Solutions would challenge those assumptions and the current share price.
- The broader checks present a mixed picture rather than a clear bargain or clear overvaluation for Honeywell International, with its value score of 4 reflecting that split.
The key question now is whether Honeywell International's current price already incorporates the weaker share performance and improving growth story, or if the gap between the intrinsic value estimate and the multiples still leaves room for mispricing.
Look beyond Honeywell International and compare this valuation puzzle with other reset stories by checking our hand picked 49 high quality undervalued stocks.
Has Honeywell International Run Too Far on Cash Flow?
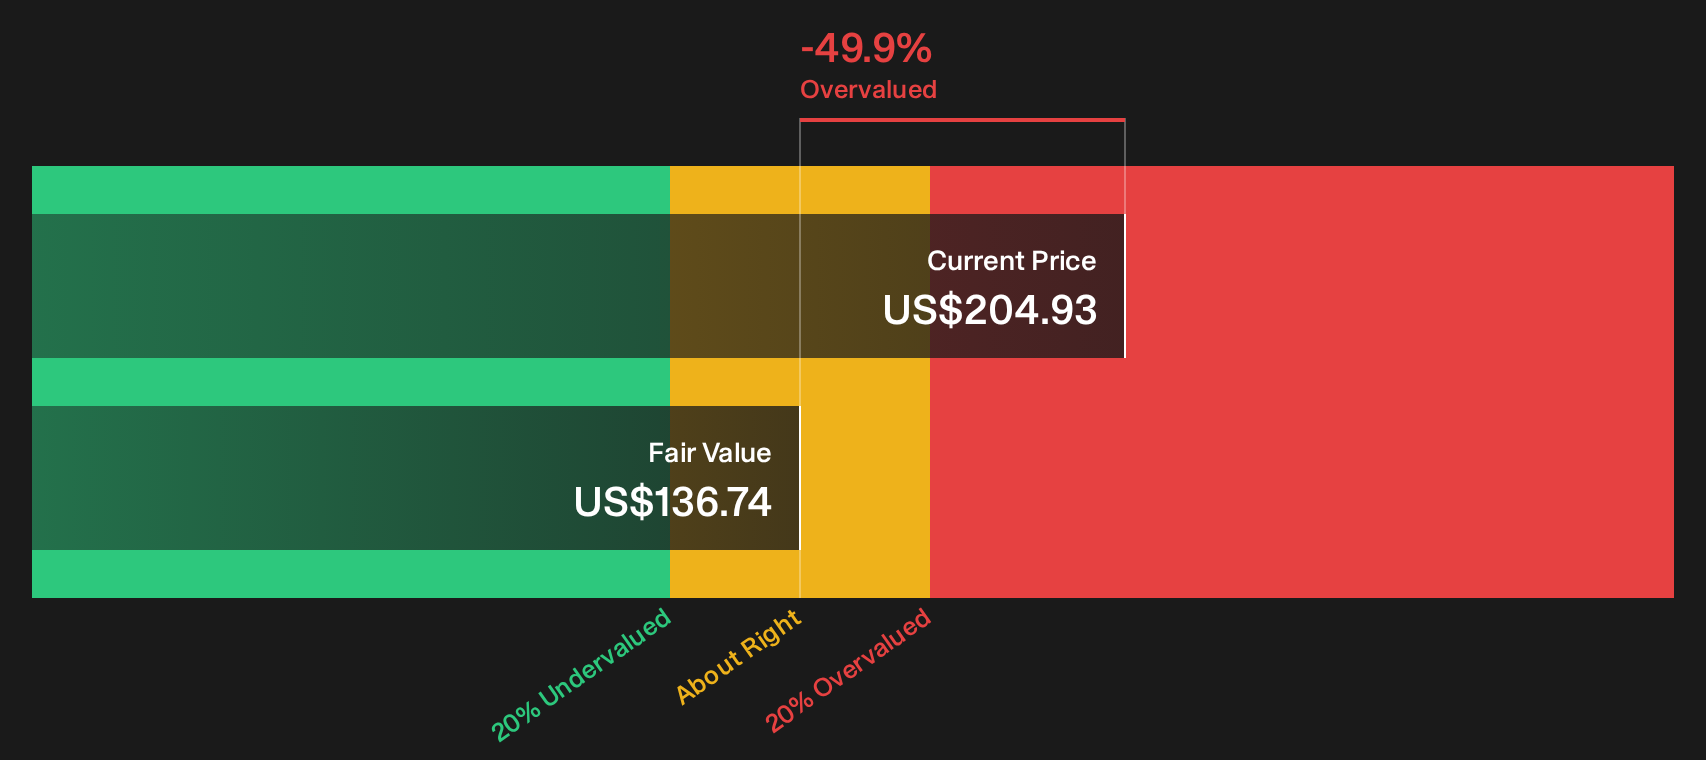
The Discounted Cash Flow model projects the cash Honeywell International can return to shareholders and brings those future dollars back to today. Honeywell generated about $4.1b of free cash flow over the last twelve months in reporting currency $, and the DCF assumes these cash flows ease back over time rather than compound aggressively. On those projections, the model points to an estimated intrinsic value of about $137 per share.
That estimate sits well below the current share price, which implies the stock trades at roughly a 49.9% premium to the DCF value, so the market is assigning a richer tag than the cash flow math alone supports. Morgan Stanley’s recent focus on a brighter growth outlook after the Aerospace spin helps explain why investors may be willing to look past the more tempered cash flow path baked into this model.
On this DCF view, Honeywell International appears overvalued relative to its projected cash generation.
Our Discounted Cash Flow (DCF) analysis suggests Honeywell International may be overvalued by 49.9%. Discover 49 high quality undervalued stocks or create your own screener to find better value opportunities.
Is Honeywell International a Bargain on Earnings?
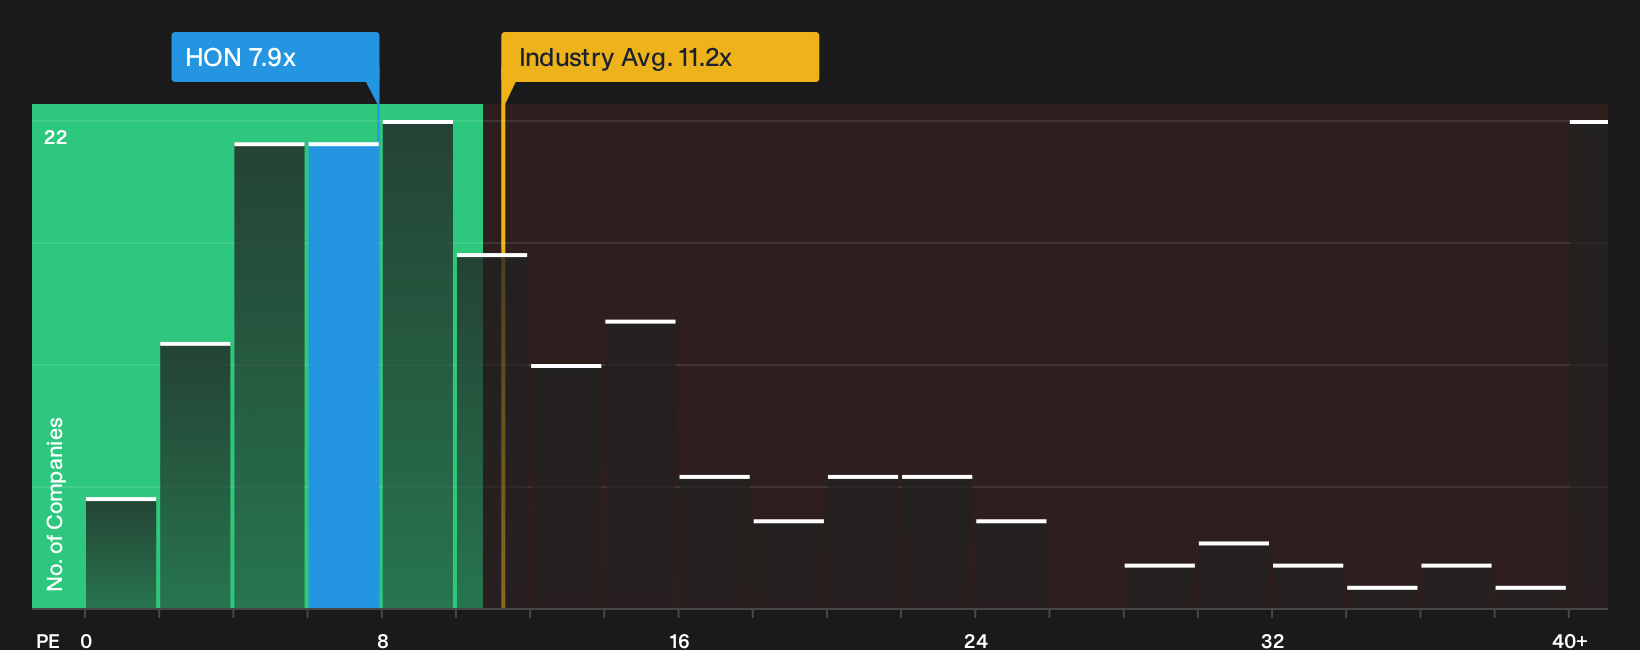
P/E is a clean way to cross check Honeywell International, since earnings for an industrial group tend to be more stable than cash flow in any single year. On this yardstick, the stock trades on around 7.9x earnings, well below the wider Industrials sector on 11.2x and far behind a peer group closer to 36.3x.
A more tailored fair P/E for Honeywell International, which blends its size, margins and sector risk, is around 16.0x. This is roughly double the current multiple, so the market is valuing each dollar of profit at a sizable discount to what this framework suggests for a business with these characteristics.
On P/E alone, Honeywell International appears undervalued, with the share price implying a much lower earnings multiple than both the sector and the modelled fair ratio.
See what the numbers say about this price — find out in our valuation breakdown.
The Honeywell International Narrative: What Would Justify Today's Price?
Simply Wall St Narratives pick up exactly where Honeywell International's valuation puzzle leaves off by explaining which growth paths, margin profiles and earnings outcomes would need to occur for the stock to be worth materially more or materially less than today's price. Each Narrative frames its fair value as a thesis about Honeywell International's business that you can revisit over time on the Community page to see how well it still fits the facts.
One of the top community narratives on Honeywell International: 36% undervalued
"While Honeywell’s core thesis remains centered on automation, aerospace, electrification, and efficiency infrastructure, the evolving policy environment may incrementally increase the strategic value of its quantum exposure over time..."
Read one of the top narratives on Honeywell International
Do you think there's more to the story for Honeywell International? Head over to our Community to see what others are saying!
The Bottom Line
Honeywell International shows a clear split. The Discounted Cash Flow (DCF) view signals an overvalued stock based on the timing and intensity of future cash generation, while the earnings multiples suggest undervaluation if growth and margins hold near current expectations. That gap mostly comes down to one question: Do future cash flows end up closer to the more cautious DCF path, or does the market keep treating Honeywell International like a higher growth industrial story that deserves a stronger P/E multiple?
This article by Simply Wall St is general in nature. We provide commentary based on historical data and analyst forecasts only using an unbiased methodology and our articles are not intended to be financial advice. It does not constitute a recommendation to buy or sell any stock, and does not take account of your objectives, or your financial situation. We aim to bring you long-term focused analysis driven by fundamental data. Note that our analysis may not factor in the latest price-sensitive company announcements or qualitative material. Simply Wall St has no position in any stocks mentioned.
Have feedback on this article? Concerned about the content? Get in touch with us directly. Alternatively, email editorial-team@simplywallst.com