
Is Catalyst Metals (ASX:CYL) Undervalued Following Full Year Earnings?
Catalyst Metals earnings event and why it matters now
Catalyst Metals (ASX:CYL) just released full year results, with sales of A$631.94 million and net income of A$171.12 million for the year to June 30, 2026.
Basic earnings per share from continuing operations came in at A$0.6625, while diluted EPS from continuing operations was A$0.6437. These figures help frame how the market now weighs the current A$6.70 share price.
Catalyst Metals has seen a 1-day share price return of 1.52% and a 30-day share price return of 3.72%. However, the year-to-date share price return is down 9.21%, while the 1-year total shareholder return has fallen 18.49%. This is set against a very large 3-year total shareholder return above 10x that hints at earlier enthusiasm now moderating as investors reassess growth and risk after the latest earnings release.
Scan how Catalyst Metals compares to other gold producers by reviewing a curated set of 35 elite gold producer stocks that are aligned with strong recent earnings momentum.
Catalyst Metals now trades at a steep discount to both analyst targets and intrinsic estimates after a strong earnings year and a mixed share price run. Is that caution sensible, or an overcorrection on risk?
Price-to-Earnings of 10.2x for Catalyst Metals: Is it justified?
Catalyst Metals trades on a P/E of 10.2x at a share price of A$6.70, which screens as modest against its own growth profile and analyst expectations.
The P/E ratio compares what investors pay today for each dollar of current earnings. For a gold producer like Catalyst Metals, that metric often reflects how the market weighs future production, costs, and metal price sensitivity against the current profit base.
Analyst forecasts imply earnings growth of about 22.3% per year with Return on Equity projected at 25.5%. The stock changes hands on 10.2x earnings versus an estimated fair P/E of 20.3x. The business is also described as good value versus the broader Australian Metals and Mining industry on this measure, given the sector average of 12.3x. That combination signals a gap between what the regression based fair ratio suggests the market could move toward and where the shares actually trade today.
Compared with peers on a straight read across, CYL is called slightly expensive versus a 10.1x peer average. Yet the fair P/E estimate is roughly double the current multiple. This leaves a mixed message, where simple peer comparisons point to a full price, while growth and return metrics embedded in the fair ratio frame the 10.2x level as potentially conservative if forecasts hold.
Explore the SWS fair ratio for Catalyst Metals.
Result: Price-to-Earnings of 10.2x (UNDERVALUED).
Still, the recent share price decline over the past year, along with full exposure to Australian gold operations, leaves Catalyst Metals sensitive to metal prices and local cost pressures.
Find out about the key risks to this Catalyst Metals narrative.
Another view on Catalyst Metals valuation
The P/E workup presents Catalyst Metals as modestly priced, while the SWS DCF model points to something much sharper. On that framework, A$6.70 compares with an estimated future cash flow value of A$22.72, which screens as very undervalued. Is the market underestimating cash generation risk, or simply pricing it more conservatively than the model?
Look into how the SWS DCF model arrives at its fair value.
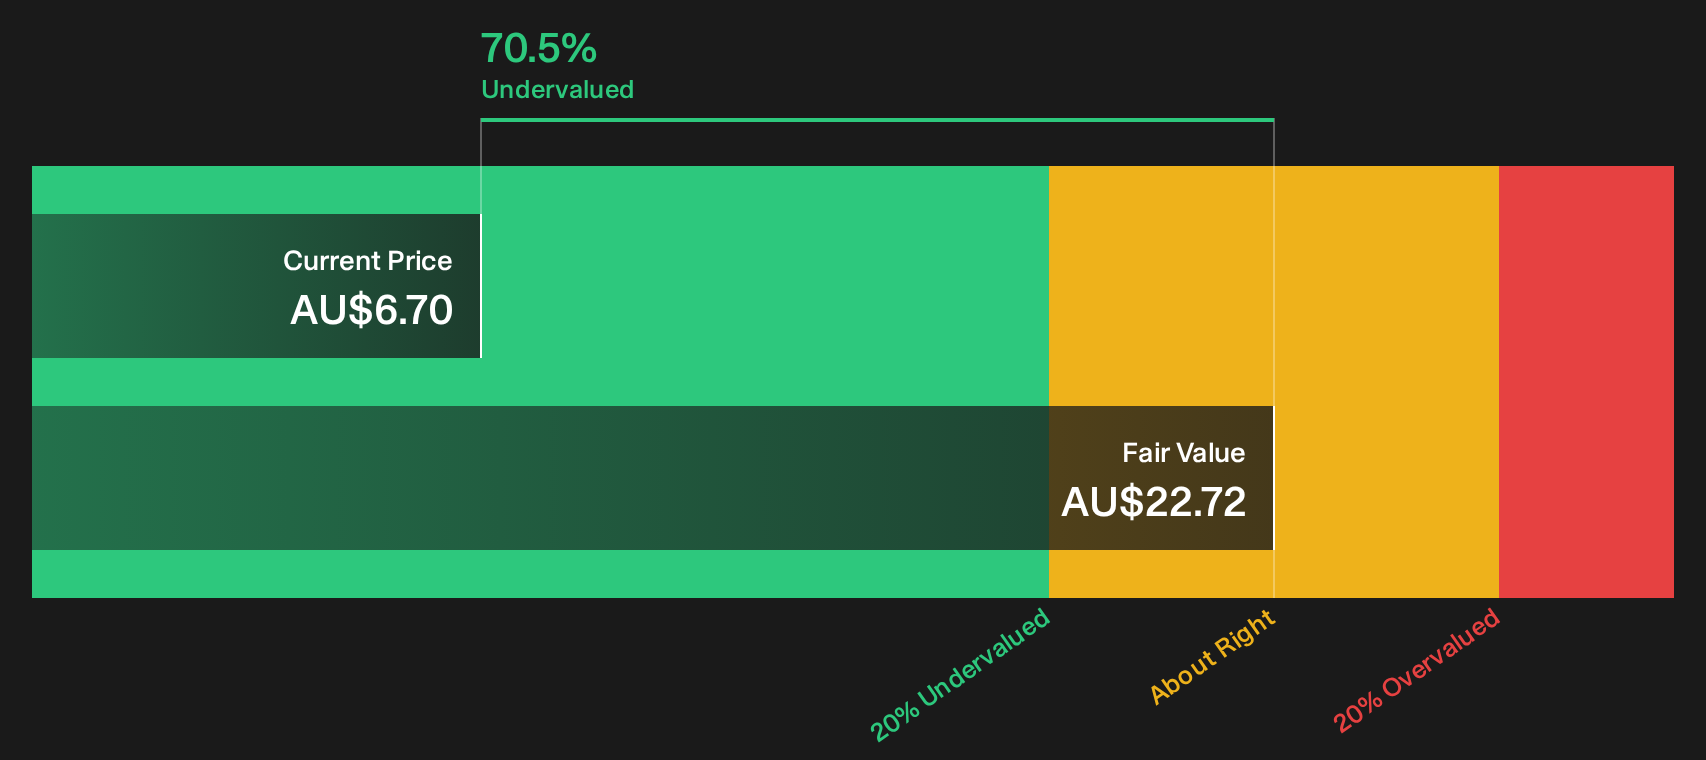
Simply Wall St performs a discounted cash flow (DCF) on every stock in the world every day (check out Catalyst Metals for example). We show the entire calculation in full. You can track the result in your watchlist or portfolio and be alerted when this changes, or use our stock screener to discover 12 high quality undervalued stocks. If you save a screener we even alert you when new companies match - so you never miss a potential opportunity.
Next Steps
Plenty in this Catalyst Metals story points in different directions, which is exactly why the timing of your own judgment matters. To consider the mix of concern and optimism, weigh the 4 key rewards and 1 important warning sign.
Looking for more investment ideas beyond Catalyst Metals?
If you stop with Catalyst Metals, you risk missing other setups that match your style. Put a few minutes into finding fresh ideas that actually fit you.
- Spot potential bargains early by scanning a 13 high quality undiscovered gems that filters for quality businesses still flying under most investors' radar.
- Prioritise resilience by working through a 14 resilient stocks with low risk scores that highlights companies with more stable risk profiles and fewer red flags.
- Target value plus strength by reviewing a list of solid balance sheet and fundamentals (11 results) that narrows the field to financially robust opportunities worth a closer look.
This article by Simply Wall St is general in nature. We provide commentary based on historical data and analyst forecasts only using an unbiased methodology and our articles are not intended to be financial advice. It does not constitute a recommendation to buy or sell any stock, and does not take account of your objectives, or your financial situation. We aim to bring you long-term focused analysis driven by fundamental data. Note that our analysis may not factor in the latest price-sensitive company announcements or qualitative material. Simply Wall St has no position in any stocks mentioned.
Have feedback on this article? Concerned about the content? Get in touch with us directly. Alternatively, email editorial-team@simplywallst.com