
Barrick (B) Stock May Be A Bargain On Earnings But Full On Cash Flow
Barrick Mining stock has delivered a very strong 197.6% return over the past three years, while current valuation checks send mixed signals about how much is already reflected in the price. The intrinsic value estimate from a Discounted Cash Flow (DCF) framework points to the shares trading at a premium, while simpler market multiple comparisons suggest the stock may still be on the cheap side.
- The 197.6% three year return highlights how strongly Barrick Mining has rewarded shareholders, which raises the bar for any further upside from here.
- Recent news such as the Pen Gold Project earn in agreement can support expectations for longer term production and cash flow, while higher cost pressures and execution risk on growth projects may cap how much investors are willing to pay for those future cash flows.
- The blended value checks, with a value score of 3, point to a mixed picture rather than a clear bargain or clear overvaluation for Barrick Mining at current levels.
The issue now is whether Barrick Mining's strong three year run leaves enough valuation support for new investors or mainly reflects gains already earned.
Balance Barrick Mining's strong three year run by scanning a curated list of other gold producers with resilient fundamentals through 35 elite gold producer stocks
Is Barrick Mining Getting Expensive on Cash Flow?
The Discounted Cash Flow (DCF) model values Barrick Mining by projecting future cash flows and discounting them back to today. On this view, the company’s latest twelve month free cash flow sits at about $4.6b, with the model assuming that cash generation eases back over time rather than climbing aggressively.
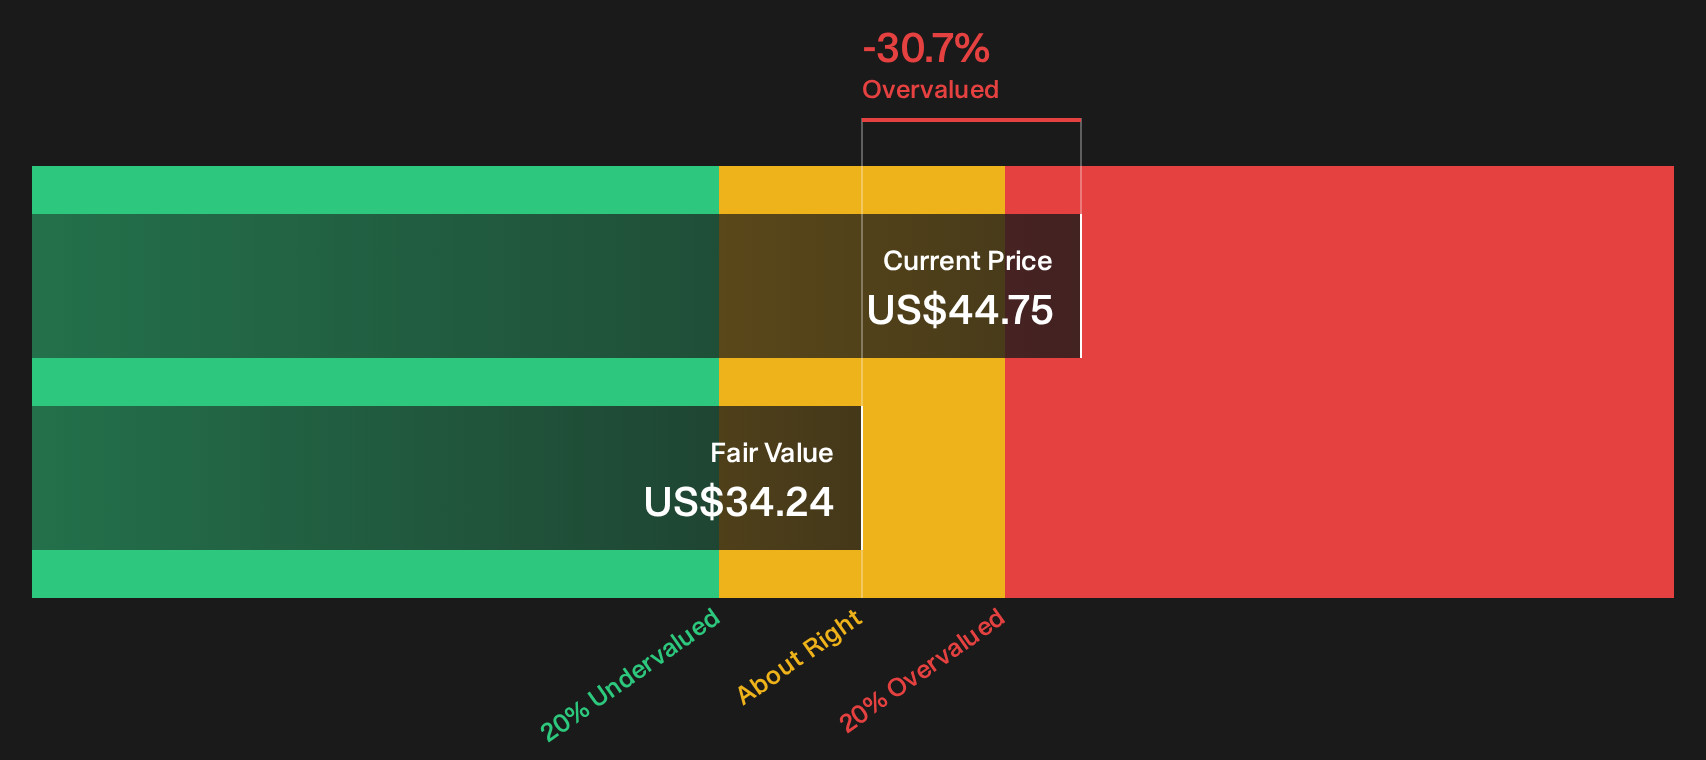
That cash flow path produces an estimated intrinsic value of about $34.24 per share, which is above the current share price and indicates that, within this model, Barrick Mining appears overvalued by roughly 30.7%. The recent Pen Gold Project earn in agreement helps explain why the market is willing to price the stock ahead of what the current DCF assumptions support.
On balance, the Discounted Cash Flow view suggests Barrick Mining stock currently looks overvalued.
Our Discounted Cash Flow (DCF) analysis suggests Barrick Mining may be overvalued by 30.7%. Discover 47 high quality undervalued stocks or create your own screener to find better value opportunities.
Is Barrick Mining a Bargain on Earnings?
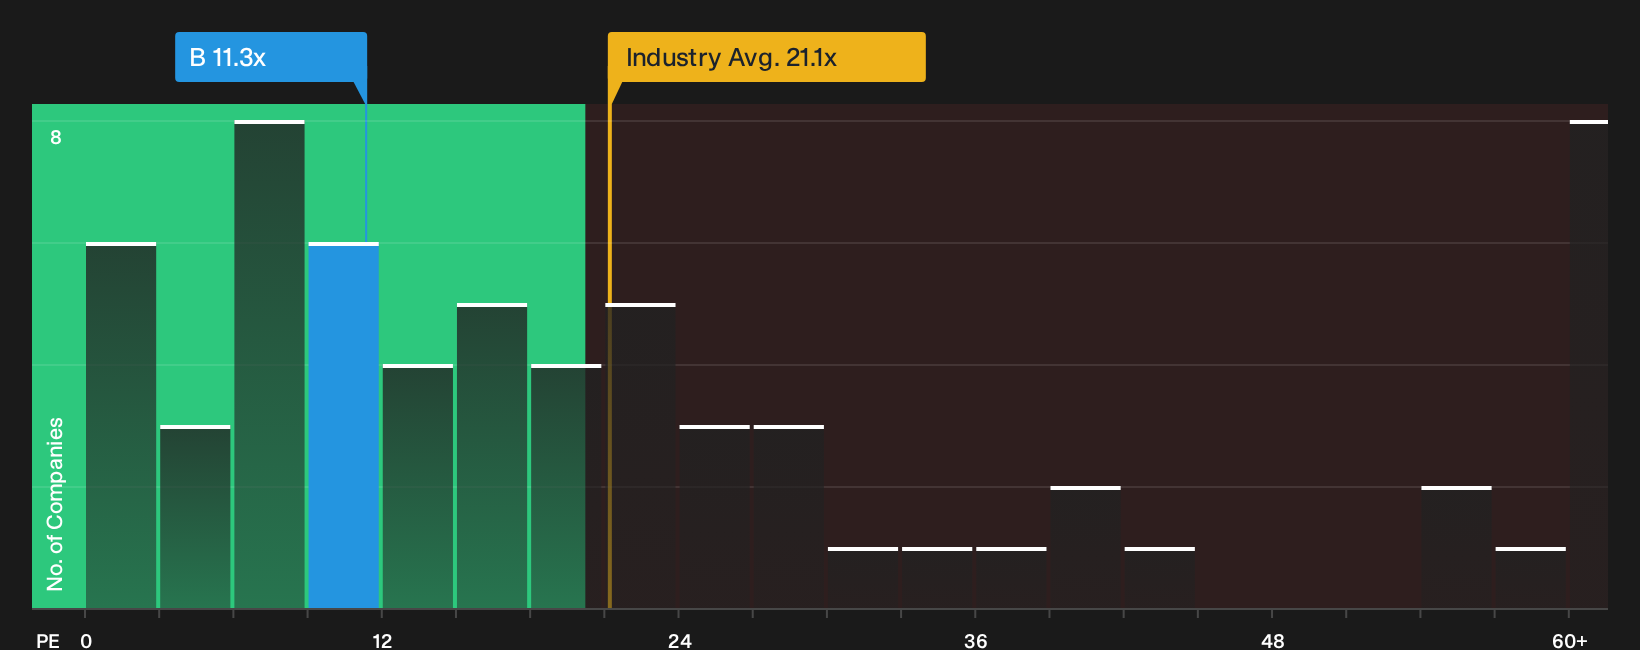
The P/E multiple is a useful cross check for Barrick Mining because it ties directly to the earnings that ultimately support shareholder returns. Barrick Mining currently trades on a P/E of about 11.3x, which is well below the broader metals and mining industry average of roughly 21.1x and also below the peer group average of about 19.5x.
The tailored fair P/E for Barrick Mining, which factors in its size, margins and risk profile, is around 22.1x. That is roughly double the current 11.3x level and indicates a sizeable discount on earnings. For investors, this suggests the three year share price performance has not pushed the P/E up to peer or fair value territory, even with projects such as Pen Gold now in the mix.
On this P/E yardstick, Barrick Mining stock appears undervalued compared with both its industry and what its own earnings profile would typically justify.
See what the numbers say about this price — find out in our valuation breakdown.
The Barrick Mining Narrative: What Would Justify Today's Price?
Simply Wall St Narratives help connect the valuation puzzle around Barrick Mining's DCF and P/E signals with the specific expectations that would need to play out on growth, margins and earnings for the stock to be worth materially more or materially less than today. Rather than relying on a single multiple or model output, each narrative lays out the assumptions behind its view of fair value so you can compare them with Barrick Mining's actual results on the Community page as they are reported.
Add your voice to the Simply Wall St community by sharing a Narrative on Barrick Mining that lays out your numbers-based view. You can explain how you see developments such as the Pen Gold Project earn-in agreement shaping Barrick Mining's future, and then track how your thesis holds up as results arrive.
Do you think there's more to the story for Barrick Mining? Head over to our Community to see what others are saying!
The Bottom Line
Barrick Mining presents a split picture. The Discounted Cash Flow (DCF) intrinsic value view points to the stock trading ahead of its modelled cash flows, while the earnings multiple suggests the shares screen undervalued against peers. The broader value checks look mixed, so neither signal dominates. The key question is whether Barrick Mining can convert its project pipeline into reliable, capital efficient cash flow that supports a higher multiple without stretching the intrinsic value case too far.
This article by Simply Wall St is general in nature. We provide commentary based on historical data and analyst forecasts only using an unbiased methodology and our articles are not intended to be financial advice. It does not constitute a recommendation to buy or sell any stock, and does not take account of your objectives, or your financial situation. We aim to bring you long-term focused analysis driven by fundamental data. Note that our analysis may not factor in the latest price-sensitive company announcements or qualitative material. Simply Wall St has no position in any stocks mentioned.
Have feedback on this article? Concerned about the content? Get in touch with us directly. Alternatively, email editorial-team@simplywallst.com