
3 Asian Dividend Stocks Offering Up To 10.5% Yield
Amidst global uncertainties and fluctuating economic indicators, Asian markets have been navigating a complex landscape marked by concerns over inflation and geopolitical tensions. In this environment, dividend stocks can offer investors a measure of stability through consistent income streams, making them an attractive option for those seeking to balance risk and reward.
Top 10 Dividend Stocks In Asia
| Name | Dividend Yield | Dividend Rating |
| SIGMAXYZ Holdings (TSE:6088) | 4.63% | ★★★★★★ |
| Sakai Moving ServiceLtd (TSE:9039) | 3.89% | ★★★★★★ |
| OUG Holdings (TSE:8041) | 3.78% | ★★★★★★ |
| Nippon Carbon (TSE:5302) | 4.08% | ★★★★★★ |
| Kumagai GumiLtd (TSE:1861) | 3.85% | ★★★★★★ |
| HUAYU Automotive Systems (SHSE:600741) | 6.51% | ★★★★★★ |
| Guangxi LiuYao Group (SHSE:603368) | 4.28% | ★★★★★★ |
| GakkyushaLtd (TSE:9769) | 4.83% | ★★★★★★ |
| CTCI Advanced Systems (TPEX:5209) | 8.15% | ★★★★★★ |
| Argosy Research (TPEX:3217) | 6.50% | ★★★★★★ |
Click here to see the full list of 1039 stocks from our Top Asian Dividend Stocks screener.
Here's a peek at a few of the choices from the screener.
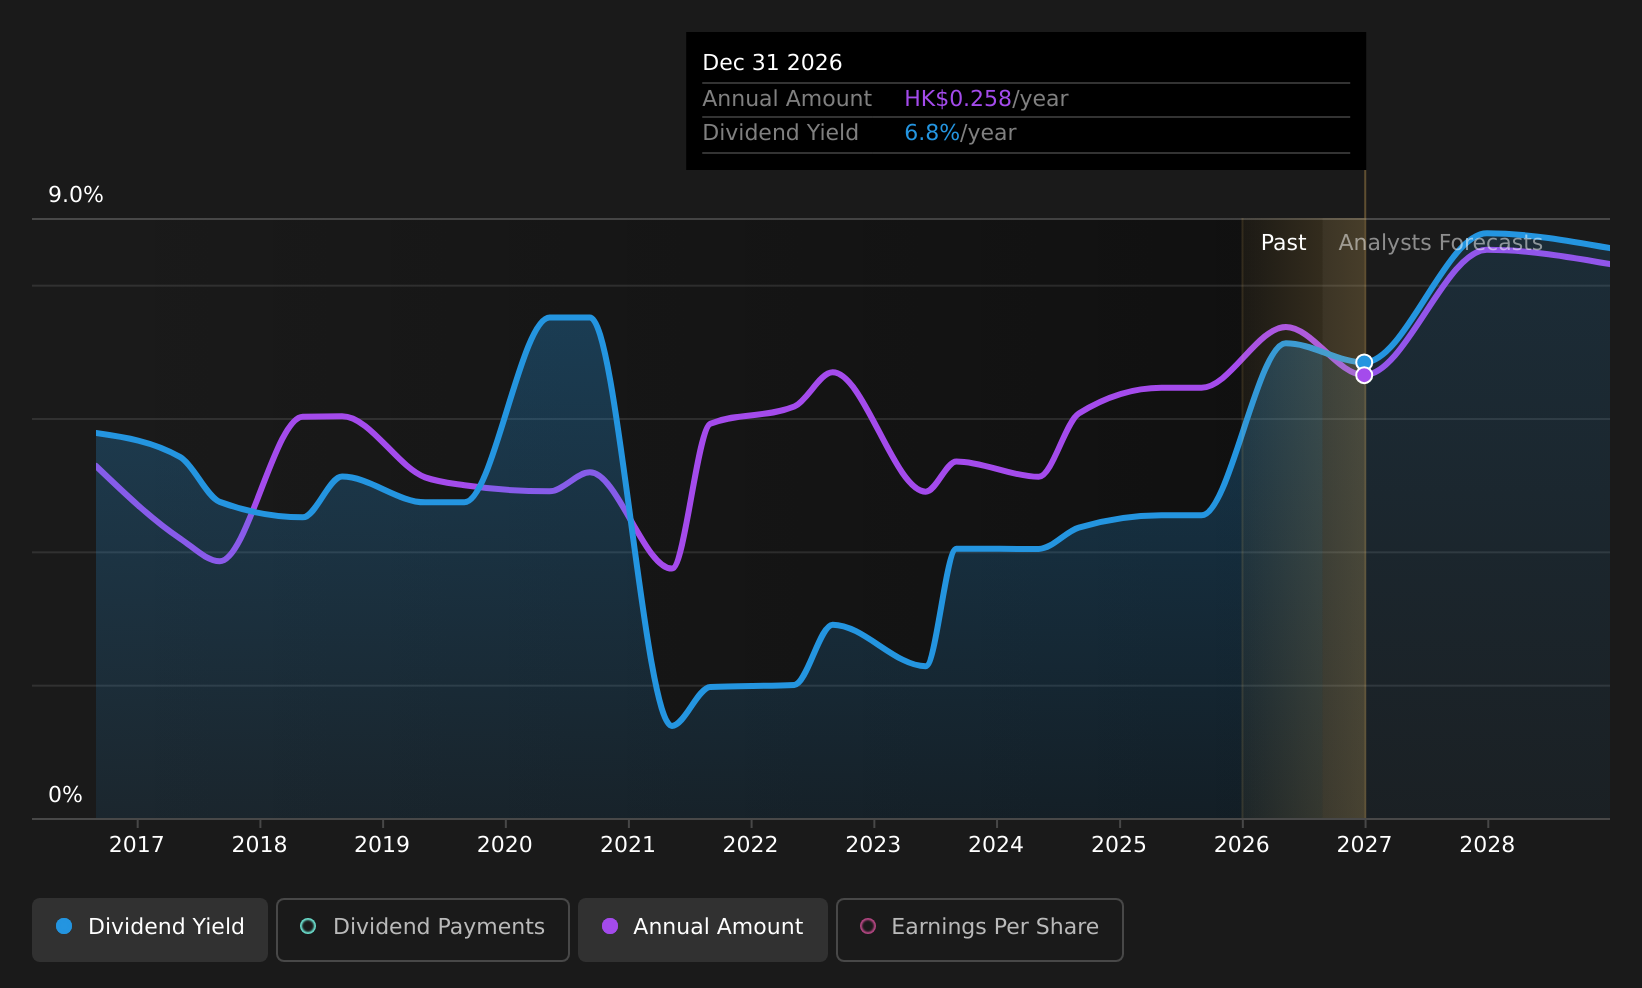
Xtep International Holdings (SEHK:1368)
Simply Wall St Dividend Rating: ★★★★☆☆
Overview: Xtep International Holdings Limited, with a market cap of HK$10.36 billion, designs, develops, manufactures, markets, and sells footwear, apparel, and accessories for adults and children in Mainland China.
Operations: Xtep International Holdings Limited generates revenue from two main segments: Mass Market, contributing CN¥12.52 billion, and Professional Sports, accounting for CN¥1.64 billion.
Dividend Yield: 7.6%
Xtep International Holdings' dividend yield of 7.63% is among the top in the Hong Kong market, but its dividend payments have been volatile over the past decade and are not well covered by free cash flows. Despite trading at a significant discount to its estimated fair value, Xtep's earnings for H1 2026 showed a decline, with net income dropping from CNY 913.57 million to CNY 817.89 million year-on-year, potentially impacting future dividend stability.
- Dive into the specifics of Xtep International Holdings here with our thorough dividend report.
- Our expertly prepared valuation report Xtep International Holdings implies its share price may be lower than expected.
Best Pacific International Holdings (SEHK:2111)
Simply Wall St Dividend Rating: ★★★★★☆
Overview: Best Pacific International Holdings Limited, along with its subsidiaries, is involved in the manufacturing, trading, and selling of elastic fabric, elastic webbing, and lace with a market cap of HK$2.62 billion.
Operations: Best Pacific International Holdings Limited generates revenue through its core operations of manufacturing, trading, and selling elastic fabric, elastic webbing, and lace.
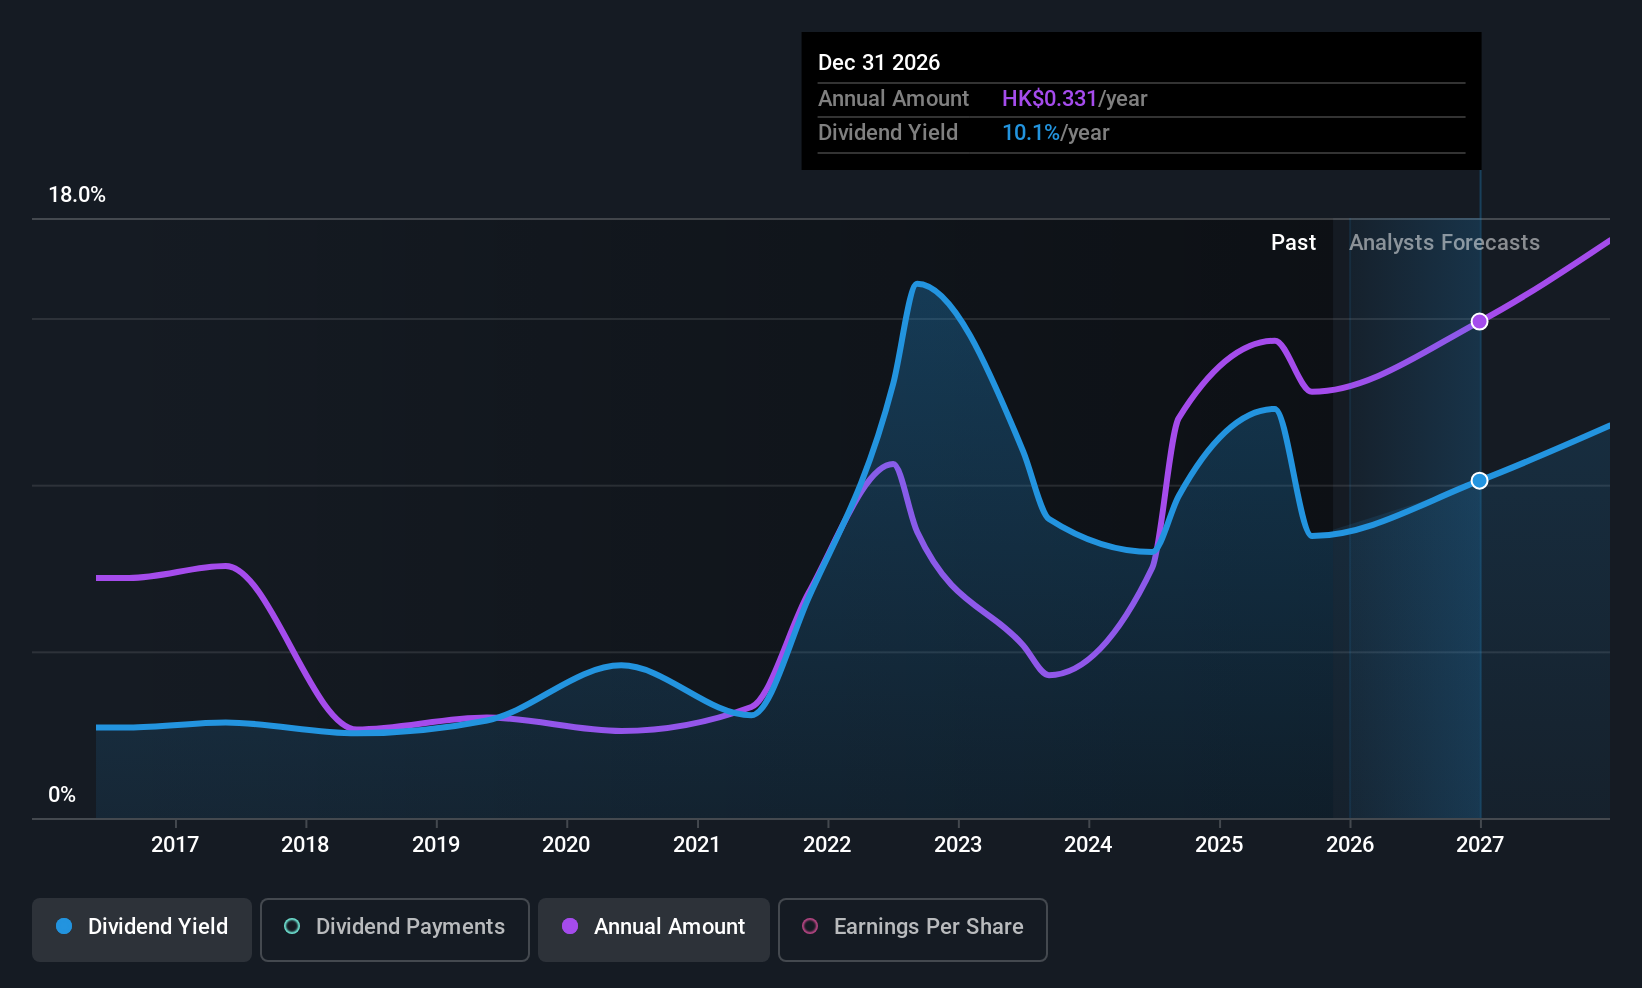
Dividend Yield: 10.5%
Best Pacific International Holdings offers a high dividend yield, ranking in the top 25% of Hong Kong payers. However, its dividend history has been unstable over the past decade. Despite this volatility, dividends are well-covered by both earnings and cash flows, with payout ratios of 26.8% and 39.9%, respectively. Recent earnings showed slight net income decline to HK$252.19 million for H1 2026 despite increased sales, highlighting potential future challenges in maintaining consistent dividends.
- Get an in-depth perspective on Best Pacific International Holdings' performance by reading our dividend report here.
- According our valuation report, there's an indication that Best Pacific International Holdings' share price might be on the cheaper side.
Ping An Insurance (Group) Company of China (SHSE:601318)
Simply Wall St Dividend Rating: ★★★★★★
Overview: Ping An Insurance (Group) Company of China, Ltd. operates as a leading provider of insurance, banking, and financial services with a market cap of approximately CN¥946.77 billion.
Operations: Ping An Insurance (Group) Company of China, Ltd. generates revenue from various segments including Life and Health Insurance (CN¥346.03 billion), Property and Casualty Insurance (CN¥356.25 billion), Banking (CN¥209.29 billion), Asset Management Business (CN¥71.93 billion), and Finance Enablement Business (CN¥52.92 billion).
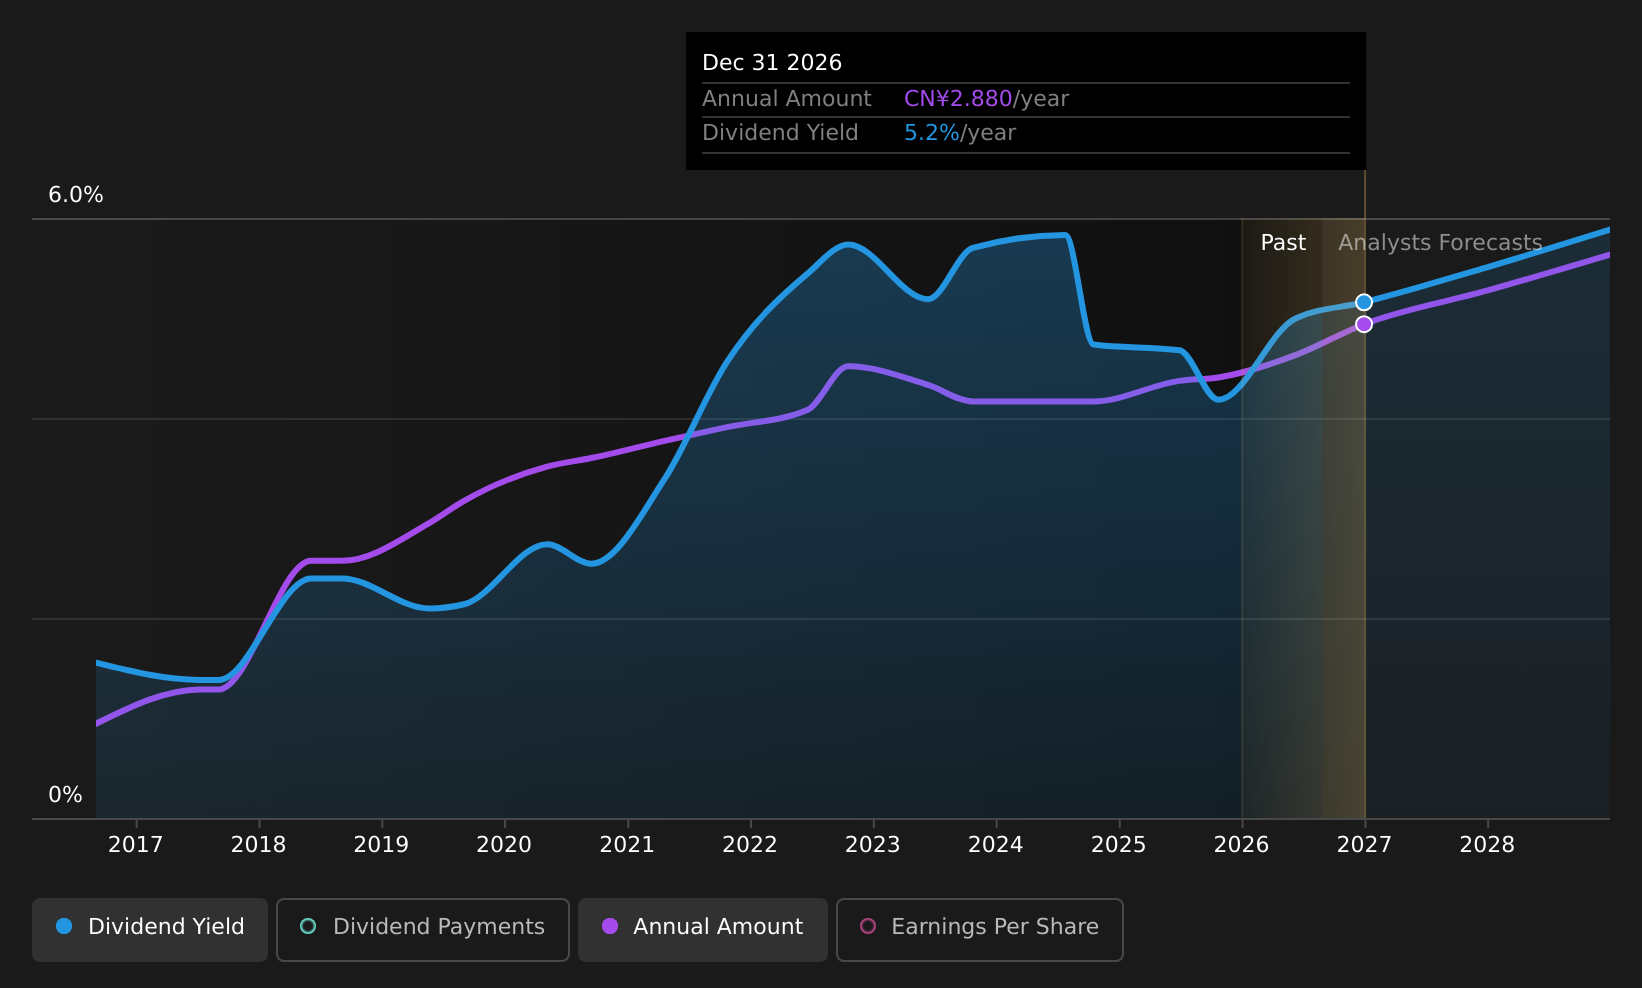
Dividend Yield: 4.9%
Ping An Insurance (Group) Company of China provides a strong dividend profile with a yield in the top 25% of the Chinese market. Recent earnings growth, with net income reaching CNY 92.59 billion for H1 2026, supports its interim dividend increase to RMB 0.98 per share. The dividends are well-covered by both earnings and cash flows, boasting low payout ratios of 30% and 7.2%, respectively, indicating sustainability and reliability over the past decade.
- Click here and access our complete dividend analysis report to understand the dynamics of Ping An Insurance (Group) Company of China.
- In light of our recent valuation report, it seems possible that Ping An Insurance (Group) Company of China is trading behind its estimated value.
Turning Ideas Into Actions
- Unlock more gems! Our Top Asian Dividend Stocks screener has unearthed 1036 more companies for you to explore.Click here to unveil our expertly curated list of 1039 Top Asian Dividend Stocks.
- Already own these companies? Link your portfolio to Simply Wall St and get alerts on any new warning signs to your stocks.
- Invest smarter with the free Simply Wall St app providing detailed insights into every stock market around the globe.
Contemplating Other Strategies?
- Explore high-performing small cap companies that haven't yet garnered significant analyst attention.
- Fuel your portfolio with companies showing strong growth potential, backed by optimistic outlooks both from analysts and management.
- Find companies with promising cash flow potential yet trading below their fair value.
This article by Simply Wall St is general in nature. We provide commentary based on historical data and analyst forecasts only using an unbiased methodology and our articles are not intended to be financial advice. It does not constitute a recommendation to buy or sell any stock, and does not take account of your objectives, or your financial situation. We aim to bring you long-term focused analysis driven by fundamental data. Note that our analysis may not factor in the latest price-sensitive company announcements or qualitative material. Simply Wall St has no position in any stocks mentioned.
Have feedback on this article? Concerned about the content? Get in touch with us directly. Alternatively, email editorial-team@simplywallst.com