
Xinyi Solar Holdings (SEHK:968) Looks Pricey Following Finance Leadership Change
Investors in Xinyi Solar Holdings (SEHK:968) are assessing a fresh leadership shift after the company announced the retirement of executive director and financial controller Mr. Chu Charn Fai and the appointment of Mr. Lam Chi Kwong.
See our latest analysis for Xinyi Solar Holdings.
At a latest share price of HK$2.345, Xinyi Solar Holdings has seen a 1 month share price return of 11.14%, yet its year to date share price return is down 23.37% and the 5 year total shareholder return is down 86.06%. This points to recent momentum building from a much weaker long term base.
If this leadership change has you thinking about where else capital could work hard, it may be a good moment to look across the solar supply chain and power infrastructure through the 38 power grid technology and infrastructure stocks
After that sharp 1 month rebound in Xinyi Solar Holdings from a much weaker multi year base, the current HK$2.345 price still sits well below the average analyst estimate. So where does fair value really look to cluster now?
Preferred P/E of 133.5x: Is it justified?
Xinyi Solar Holdings trades on a P/E of 133.5x, which is high compared to several reference points and suggests the current HK$2.345 price builds in strong earnings expectations.
The P/E ratio compares the share price to earnings per share. For Xinyi Solar Holdings this matters because earnings are a key focus for a business that produces solar glass and operates renewable energy assets, where profitability can be sensitive to power prices, input costs and utilisation rates.
Against that backdrop, the stock is described as expensive on a P/E basis compared with multiple benchmarks. Its 133.5x P/E is higher than the Asian Semiconductor industry average of 35.6x, higher than the peer average of 22.3x, and above an estimated fair P/E of 32.7x that is derived from regression analysis. Those gaps imply the market is assigning a much richer earnings multiple than both sector peers and the fair ratio suggest could be sustainable over time. The fair ratio provides a level the market could move towards if sentiment cools.
Explore the SWS fair ratio for Xinyi Solar Holdings
Result: Price-to-earnings of 133.5x (OVERVALUED)
However, Xinyi Solar Holdings still faces risks if earnings do not keep pace with the current P/E, or if solar glass and power project economics become less favourable.
Find out about the key risks to this Xinyi Solar Holdings narrative.
Another view on Xinyi Solar Holdings valuation
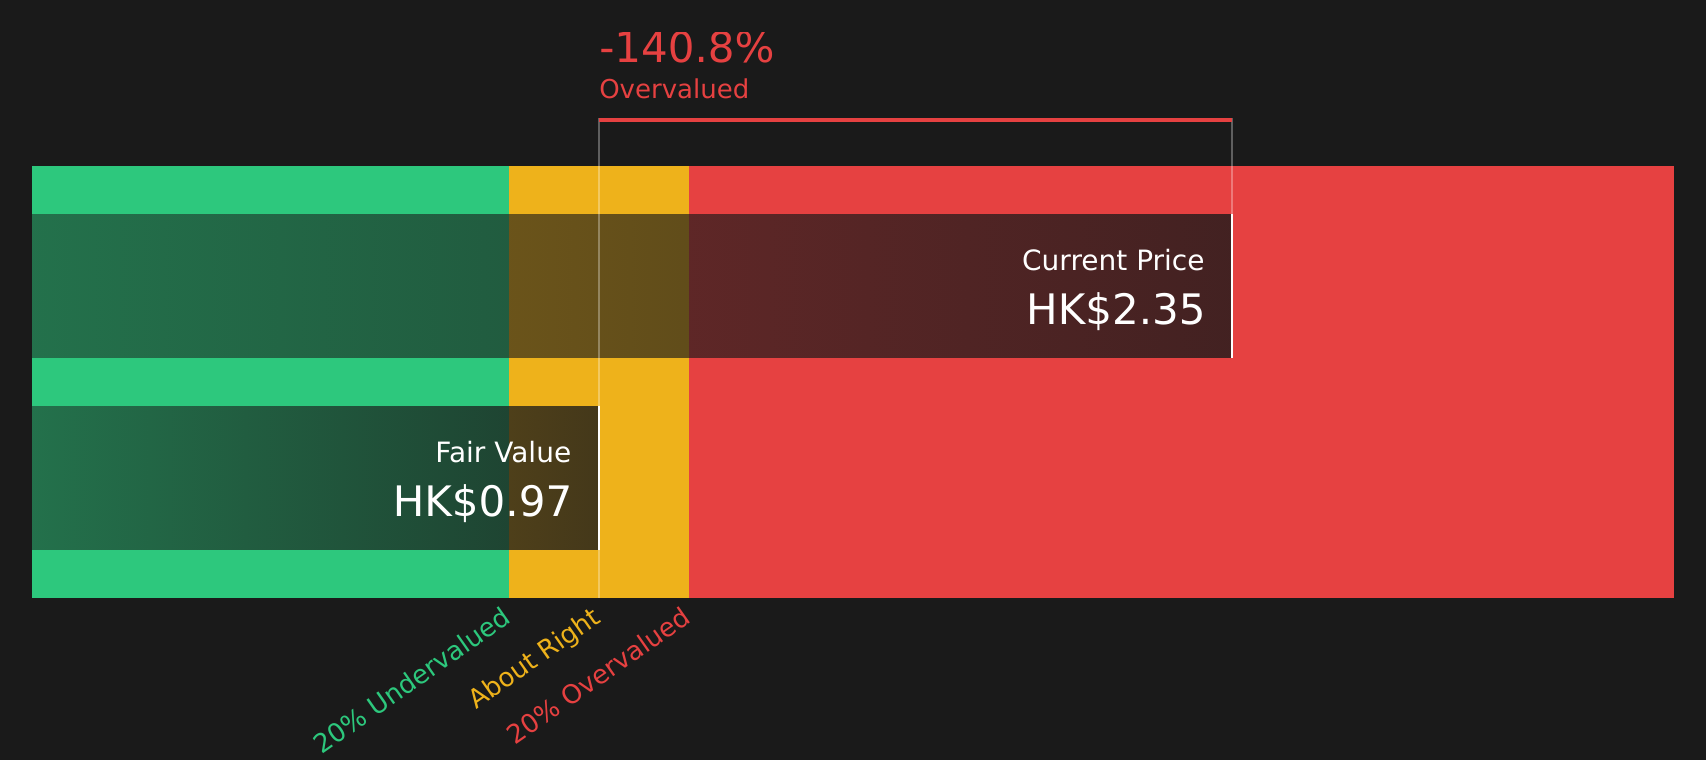
While the 133.5x P/E suggests Xinyi Solar Holdings is expensive, the SWS DCF model points in the same direction. At a current share price of HK$2.345, the stock trades above an estimated future cash flow value of HK$0.97, which means the cash flow based model indicates overvaluation as well. If both earnings and cash flows appear stretched at today’s price, what factors might alter that assessment?
Look into how the SWS DCF model arrives at its fair value.
Simply Wall St performs a discounted cash flow (DCF) on every stock in the world every day (check out Xinyi Solar Holdings for example). We show the entire calculation in full. You can track the result in your watchlist or portfolio and be alerted when this changes, or use our stock screener to discover 274 high quality undervalued stocks. If you save a screener we even alert you when new companies match - so you never miss a potential opportunity.
Next Steps
With mixed signals around Xinyi Solar Holdings, it helps to look past headlines and into the full set of checks. To weigh the balance of potential risks and rewards, start by reviewing the 2 key rewards and 1 important warning sign
Looking for more investment ideas beyond Xinyi Solar Holdings?
If Xinyi Solar Holdings has you reassessing where your capital could work harder, now is a smart time to scan wider opportunities using targeted stock screeners.
- Spot potential turnaround opportunities early by reviewing 216 elite penny stocks with strong financials that already show stronger financial underpinnings than many ultra low priced stocks.
- Focus on value and quality together by checking the 274 high quality undervalued stocks that combine robust fundamentals with prices that may not fully reflect them.
- Prioritise resilience and sleep better at night by filtering for 291 resilient stocks with low risk scores that score well on financial strength and risk metrics.
This article by Simply Wall St is general in nature. We provide commentary based on historical data and analyst forecasts only using an unbiased methodology and our articles are not intended to be financial advice. It does not constitute a recommendation to buy or sell any stock, and does not take account of your objectives, or your financial situation. We aim to bring you long-term focused analysis driven by fundamental data. Note that our analysis may not factor in the latest price-sensitive company announcements or qualitative material. Simply Wall St has no position in any stocks mentioned.
Have feedback on this article? Concerned about the content? Get in touch with us directly. Alternatively, email editorial-team@simplywallst.com