
Talamore Mining (TSX:TALA) Could Be 89% Undervalued After Loss And Index Exit
Talamore Mining (TSX:TALA) is under closer watch after reporting a wider second quarter 2026 net loss of CA$32.79 million and being removed from the S&P/TSX Venture Composite Index on the same day.
See our latest analysis for Talamore Mining.
Talamore Mining’s recent removal from the S&P/TSX Venture Composite Index and wider quarterly loss come after a period of strong momentum, with a year to date share price return of 68.30% and a very large 1 year total shareholder return. The latest 1 month share price return of 17.41% suggests that short term optimism has recently increased.
If you are weighing Talamore Mining’s recent swings against other opportunities in the gold space, it can be useful to see what else investors are watching through our screener of 32 elite gold producer stocks
Recent index removal, widening losses and a strong share price run leave Talamore Mining looking like a complex mix of potential and risk. Is that combination currently being valued generously or cautiously by the market?
Preferred Price to Book Multiple of 9.7x: Is It Justified?
For a company like Talamore Mining that is still loss making with no reported revenue, investors often fall back on balance sheet based gauges. The current price to book ratio of 9.7x sets a high bar for expectations compared with both peers and the wider Canadian metals and mining sector.
The P/B ratio compares Talamore Mining’s current CA$9.98 share price with the accounting value of its net assets. In capital intensive sectors such as mining, this is a common way to think about valuation when profits are not yet in focus. A 9.7x multiple means investors are paying close to ten times the company’s book value per share.
That level looks rich next to the Canadian metals and mining industry average P/B of 2.8x. It is also above the peer group average of 5x. The market is therefore putting a much higher value on Talamore Mining’s assets than on those of many competitors, even though the company is currently unprofitable and is forecast by analysts to remain loss making over the next three years.
See what the numbers say about this price — find out in our valuation breakdown.
Result: Price to book ratio of 9.7x (OVERVALUED)
However, Talamore Mining still reports no revenue and a net loss of CA$52.53 million, so any shift in funding conditions or project timelines could quickly challenge the current optimism.
Find out about the key risks to this Talamore Mining narrative.
Another View on Talamore Mining's Valuation
While the current P/B ratio makes Talamore Mining look expensive compared with peers, the SWS DCF model reaches a very different conclusion. It suggests the shares are trading at an 88.7% discount to an estimated fair value of CA$88.51 per share, which points to a large gap in expectations. Could this be a sign of mispricing, or simply very optimistic cash flow assumptions?
Look into how the SWS DCF model arrives at its fair value.
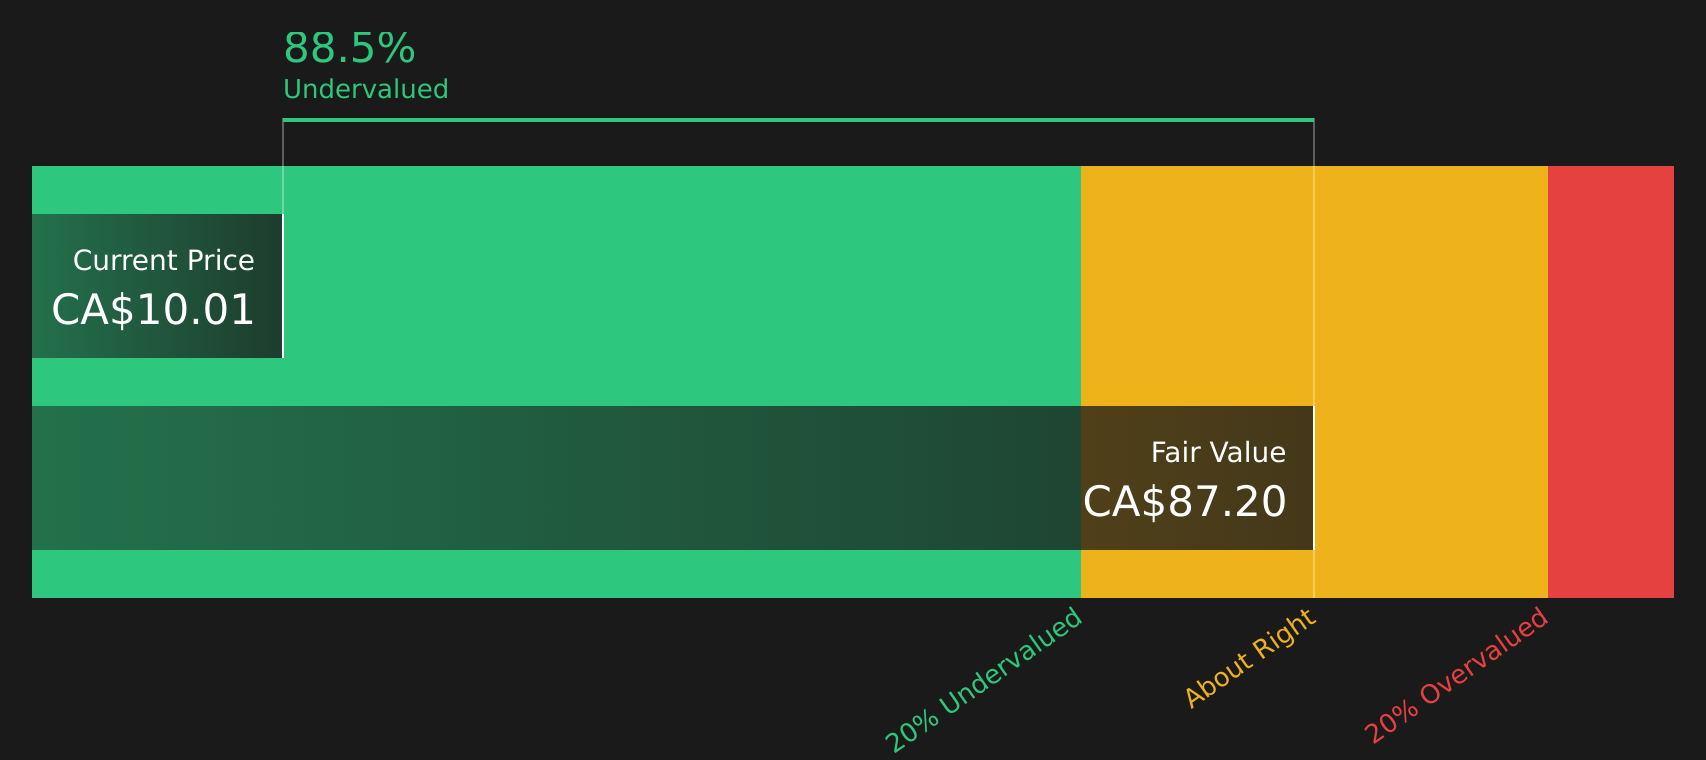
Simply Wall St performs a discounted cash flow (DCF) on every stock in the world every day (check out Talamore Mining for example). We show the entire calculation in full. You can track the result in your watchlist or portfolio and be alerted when this changes, or use our stock screener to discover 14 high quality undervalued stocks. If you save a screener we even alert you when new companies match - so you never miss a potential opportunity.
Next Steps
With sentiment on Talamore Mining clearly mixed, now is a good time to look at the underlying data yourself and decide what matters most to you. To quickly see both sides of the story in one place, review the 2 key rewards and 4 important warning signs.
Looking for more investment ideas beyond Talamore Mining?
If Talamore Mining has you thinking more broadly about your portfolio, now is a smart time to scan the wider market for fresh ideas and potential opportunities.
- Spot potential value opportunities early by checking companies that appear attractively priced on fundamentals through the 14 high quality undervalued stocks.
- Strengthen your income stream by reviewing higher yielding stocks highlighted in the 4 dividend fortresses.
- Prioritise resilience by assessing companies with sturdier finances via the solid balance sheet and fundamentals stocks screener (12 results).
This article by Simply Wall St is general in nature. We provide commentary based on historical data and analyst forecasts only using an unbiased methodology and our articles are not intended to be financial advice. It does not constitute a recommendation to buy or sell any stock, and does not take account of your objectives, or your financial situation. We aim to bring you long-term focused analysis driven by fundamental data. Note that our analysis may not factor in the latest price-sensitive company announcements or qualitative material. Simply Wall St has no position in any stocks mentioned.
Have feedback on this article? Concerned about the content? Get in touch with us directly. Alternatively, email editorial-team@simplywallst.com