
WuXi XDC Cayman (SEHK:2268) Gains Overseas GMP Release, Is The Stock Fully Priced?
WuXi XDC Cayman (SEHK:2268) has reached a new phase in its international build out with its BCM3 dual function production line in Singapore receiving GMP release and moving into global commercial manufacturing.
See our latest analysis for WuXi XDC Cayman.
Against this backdrop, WuXi XDC Cayman's momentum has been strong, with a 30 day share price return of 28.75% and a year to date share price return of 16.79%. This has contributed to a 1 year total shareholder return of 24.18% at a latest share price of HK$71.65.
If you are looking for more ideas in a sector where cutting edge therapies meet scaled manufacturing, it could be worth scanning 129 healthcare AI stocks
The recent run in WuXi XDC Cayman still leaves the stock trading at a double digit discount to both analyst targets and intrinsic estimates. Is that a clear valuation opportunity, or a warning that the market’s caution has a point?
Price to earnings of 52.6x: Is it justified for WuXi XDC Cayman?
WuXi XDC Cayman trades on a P/E of 52.6x, which points to a rich valuation relative to both its own fair ratio and sector peers at the current HK$71.65 share price.
The P/E ratio compares the company’s share price with its earnings per share and is a common way for investors to think about how much they are paying for current profits. For a contract research, development, and manufacturing specialist like WuXi XDC Cayman, a higher P/E can sometimes reflect expectations for strong profit growth or confidence in the stability of future earnings.
In this case, WuXi XDC Cayman’s 52.6x P/E is described as expensive compared with the Asian Life Sciences industry average of 39.4x and a peer group average of 32x. It is also above an estimated fair P/E of 27.6x, which suggests a level the market could potentially move toward if enthusiasm for the stock cools or earnings do not keep pace with expectations.
Explore the SWS fair ratio for WuXi XDC Cayman
Result: Price-to-earnings of 52.6x (OVERVALUED)
However, WuXi XDC Cayman still faces risks if earnings growth expectations soften, or if regulatory and client demand trends shift against high multiple contract manufacturers.
Find out about the key risks to this WuXi XDC Cayman narrative.
Another view on WuXi XDC Cayman’s valuation
While the 52.6x P/E makes WuXi XDC Cayman look expensive, the SWS DCF model suggests a different picture. At a HK$71.65 share price, the stock trades below an estimated future cash flow value of HK$84.46. That indicates a 15.2% discount. Which signal is more important for your analysis?
Look into how the SWS DCF model arrives at its fair value.
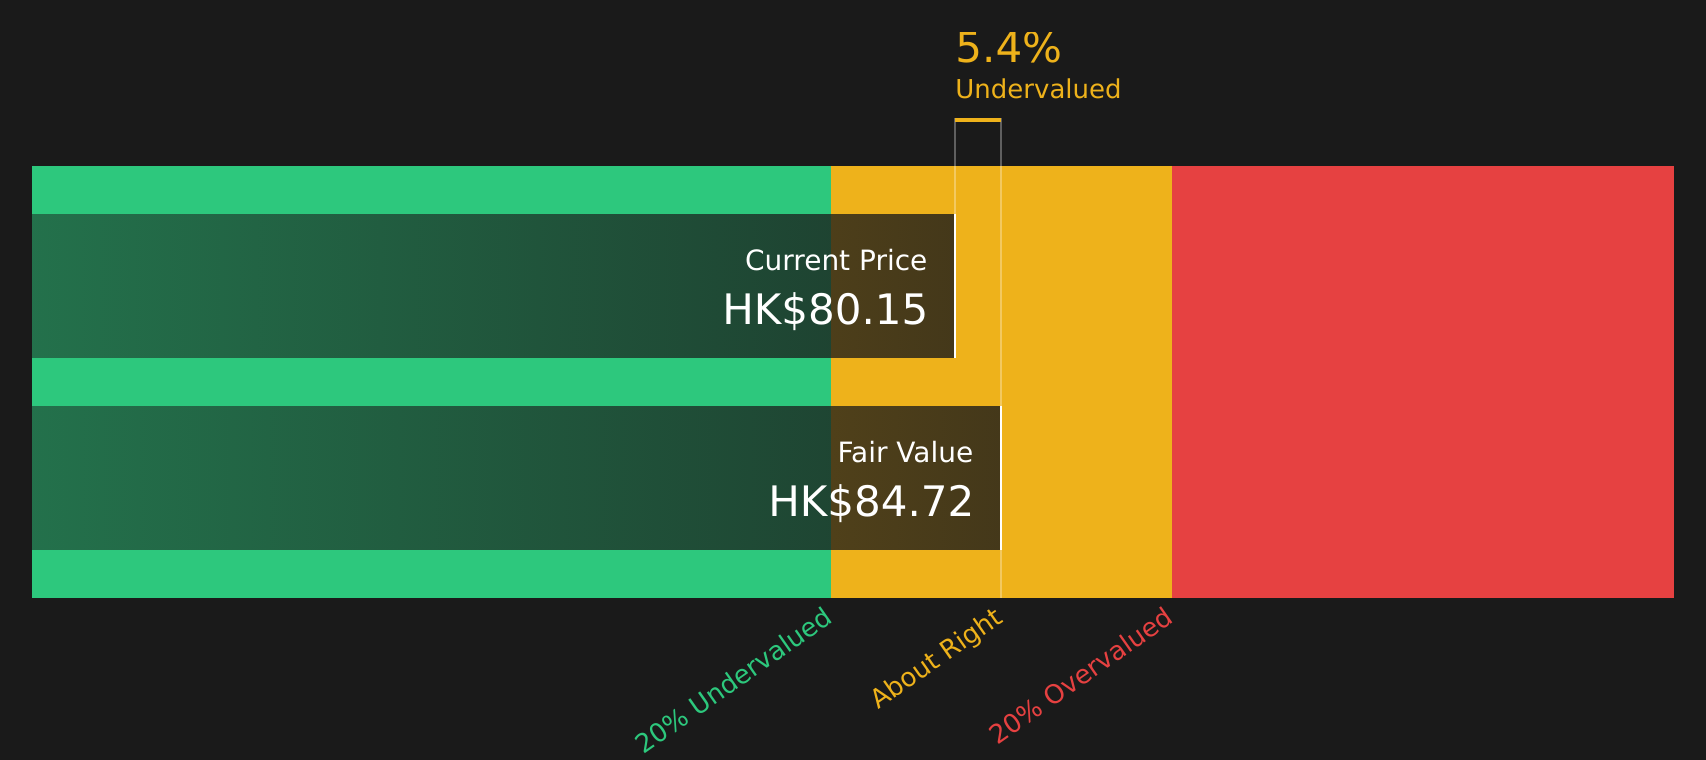
Simply Wall St performs a discounted cash flow (DCF) on every stock in the world every day (check out WuXi XDC Cayman for example). We show the entire calculation in full. You can track the result in your watchlist or portfolio and be alerted when this changes, or use our stock screener to discover 267 high quality undervalued stocks. If you save a screener we even alert you when new companies match - so you never miss a potential opportunity.
Next Steps
With mixed signals around valuation and sentiment on WuXi XDC Cayman, the next move is yours. Review the data in detail and decide where you stand using the 3 key rewards and 2 important warning signs
Looking for more investment ideas beyond WuXi XDC Cayman?
If you want a fuller watchlist around WuXi XDC Cayman, do not stop here. Broaden your horizons now so you are not reacting after opportunities move.
- Target companies that trade below what their fundamentals suggest by checking out the 267 high quality undervalued stocks.
- Strengthen your income stream by reviewing stocks in the 423 dividend fortresses that focus on higher yields with stability in mind.
- Prioritise resilience by scanning the 291 resilient stocks with low risk scores that aims to highlight companies with lower overall risk profiles.
This article by Simply Wall St is general in nature. We provide commentary based on historical data and analyst forecasts only using an unbiased methodology and our articles are not intended to be financial advice. It does not constitute a recommendation to buy or sell any stock, and does not take account of your objectives, or your financial situation. We aim to bring you long-term focused analysis driven by fundamental data. Note that our analysis may not factor in the latest price-sensitive company announcements or qualitative material. Simply Wall St has no position in any stocks mentioned.
Have feedback on this article? Concerned about the content? Get in touch with us directly. Alternatively, email editorial-team@simplywallst.com