
Undiscovered Gems in Global Markets for August 2026
In August 2026, global markets are navigating a complex landscape marked by easing inflation concerns in the U.S., mixed performances across major indices, and geopolitical uncertainties impacting energy prices. With the Russell 2000 and S&P MidCap 400 Indexes showing notable gains amid these conditions, investors are increasingly on the lookout for small-cap opportunities that could offer resilience and growth potential. In this context, identifying stocks with strong fundamentals and adaptability to current market dynamics can be crucial in uncovering undiscovered gems within global markets.
Top 10 Undiscovered Gems With Strong Fundamentals Globally
| Name | Debt To Equity | Revenue Growth | Earnings Growth | Health Rating |
|---|---|---|---|---|
| BBGI | 18.41% | 10.19% | -20.25% | ★★★★★★ |
| C-Rad | NA | 13.57% | 13.83% | ★★★★★★ |
| GROUPE SFPI | 18.02% | 4.25% | -29.76% | ★★★★★★ |
| CNMC Goldmine Holdings | 2.29% | 35.67% | 73.16% | ★★★★★☆ |
| Fourth Milling | NA | 12.93% | 16.76% | ★★★★★☆ |
| Forth Smart Service | 44.85% | -3.80% | 10.19% | ★★★★★☆ |
| Dmall | 59.68% | 15.24% | 23.16% | ★★★★★☆ |
| Skue Sparebank | 122.31% | 16.16% | 33.20% | ★★★★☆☆ |
| Sing Investments & Finance | 0.10% | 5.85% | 7.00% | ★★★★☆☆ |
| Shengda ResourcesLtd | 57.58% | 8.61% | 9.90% | ★★★☆☆☆ |
We're going to check out a few of the best picks from our screener tool.
CW Enerji Mühendislik Ticaret ve Sanayi Anonim Sirketi (IBSE:CWENE)
Simply Wall St Value Rating: ★★★☆☆☆
Overview: CW Enerji Mühendislik Ticaret ve Sanayi Anonim Sirketi operates in the photovoltaic power generation sector in Turkey, with a market capitalization of TRY39.90 billion.
Operations: CW Enerji generates revenue primarily from its Cw Energy segment, contributing TRY18.44 billion, and the CW Solar Cell segment, adding TRY4.25 billion. The company's net profit margin exhibits notable trends over recent periods.
CW Enerji, a player in the electrical industry, has demonstrated impressive earnings growth of 340.1% over the past year, outpacing its sector's 163.4%. Despite this strong performance, its debt-to-equity ratio climbed from 32.5% to 36.5% over five years, suggesting increased leverage. The company's net income for Q2 reached TRY 500.54 million compared to TRY 283.63 million previously, highlighting robust profitability with high-quality earnings and trading at a significant discount of 83.6% below estimated fair value; however, free cash flow remains negative and interest coverage is low at just 1.6x EBIT against interest payments which raises concerns about financial flexibility amidst volatile share prices recently observed in the market landscape today as future prospects seem promising given forecasted annual earnings growth rate projected around an impressive figure such as seventy-seven-point-three-eight percent (77%) per annum moving forward into upcoming fiscal periods ahead!

CSC Financial (SEHK:6066)
Simply Wall St Value Rating: ★★★★☆☆
Overview: CSC Financial Co., Ltd. operates as an investment banking service provider in Mainland China and internationally, with a market capitalization of HK$203.94 billion.
Operations: CSC Financial generates revenue primarily through its investment banking services. The company has a market capitalization of HK$203.94 billion.
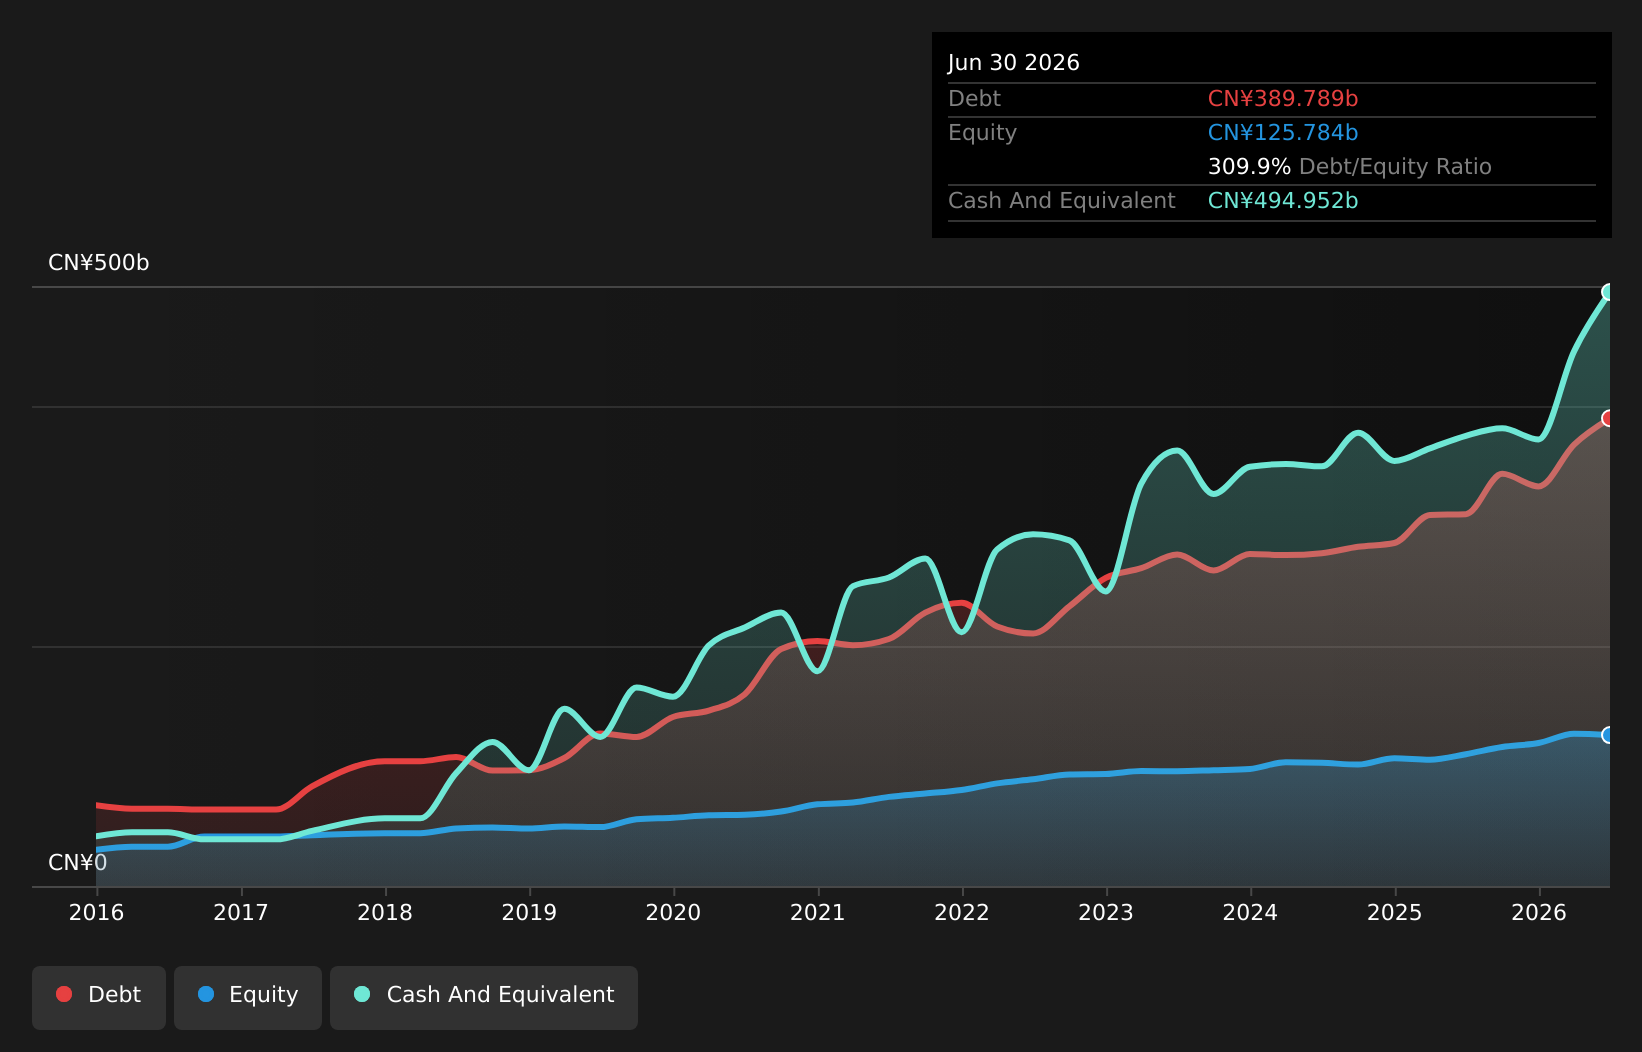
CSC Financial, a player in the financial sector, has shown robust performance with net income soaring to CNY 7.64 billion for the first half of 2026, up from CNY 4.51 billion last year. The company's earnings per share also climbed to CNY 0.92 from CNY 0.52 previously, reflecting solid growth momentum. However, its debt-to-equity ratio has increased over five years from 277% to nearly 310%, suggesting rising leverage concerns despite its profitability and positive free cash flow status at US$93 million as of June this year. Trading below fair value by about 5%, CSC appears well-positioned but faces industry challenges given slower earnings growth relative to peers in the capital markets sector.
- Dive into the specifics of CSC Financial here with our thorough health report.
Examine CSC Financial's past performance report to understand how it has performed in the past.
Chengtun Mining Group (SHSE:600711)
Simply Wall St Value Rating: ★★★☆☆☆
Overview: Chengtun Mining Group Co., Ltd. operates in the non-ferrous metal mining sector both within China and internationally, with a market capitalization of approximately CN¥34.72 billion.
Operations: The company generates revenue primarily from its non-ferrous metal mining operations. It has a market cap of approximately CN¥34.72 billion, reflecting its substantial presence in the industry.
Chengtun Mining's financial performance showcases its potential in the metals and mining sector, with earnings growth of 39.8% over the past year, surpassing industry growth of 23.8%. The company reported half-year sales of CNY 19.06 billion and revenue at CNY 19.26 billion, marking a significant increase from last year's figures of CNY 13.63 billion and CNY 13.80 billion respectively. Net income also rose to CNY 1.80 billion from CNY 1.05 billion a year ago, reflecting strong profitability despite a high net debt to equity ratio of 52.9%, which could be concerning for some investors but is well covered by EBIT at ten times interest payments.

Make It Happen
- Click this link to deep-dive into the 168 companies within our Global Undiscovered Gems With Strong Fundamentals screener.
- Hold shares in these firms? Setup your portfolio in Simply Wall St to seamlessly track your investments and receive personalized updates on your portfolio's performance.
- Maximize your investment potential with Simply Wall St, the comprehensive app that offers global market insights for free.
Want To Explore Some Alternatives?
- Explore high-performing small cap companies that haven't yet garnered significant analyst attention.
- Fuel your portfolio with companies showing strong growth potential, backed by optimistic outlooks both from analysts and management.
- Find companies with promising cash flow potential yet trading below their fair value.
This article by Simply Wall St is general in nature. We provide commentary based on historical data and analyst forecasts only using an unbiased methodology and our articles are not intended to be financial advice. It does not constitute a recommendation to buy or sell any stock, and does not take account of your objectives, or your financial situation. We aim to bring you long-term focused analysis driven by fundamental data. Note that our analysis may not factor in the latest price-sensitive company announcements or qualitative material. Simply Wall St has no position in any stocks mentioned.
Have feedback on this article? Concerned about the content? Get in touch with us directly. Alternatively, email editorial-team@simplywallst.com